Check your rules with Rules Debugger
Rules Debugger Navigation
- The Rules debugger is an option that assists in the detection and correction of errors while executing the rules in a form preview.
- The rule debugger helps the user to execute the rules step by step, by setting the debug points
- Below are the steps to set the rule debugger.
Set Debugger
- Drag a search control into the form and configure it with the datasource.
- Fill the search using FillData trigger.
- After creating the FillData rule for search control.
- Right click over the rule and navigate to ‘Set Debug’ (Figure 1).
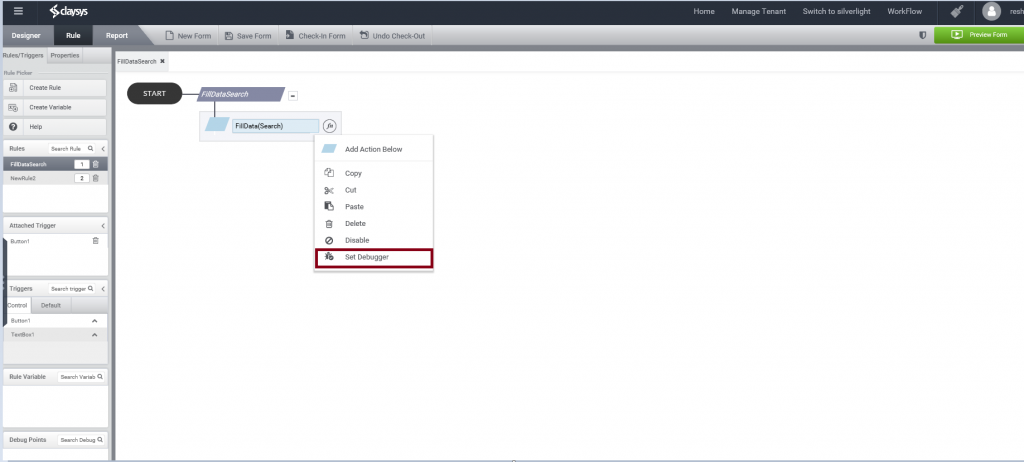
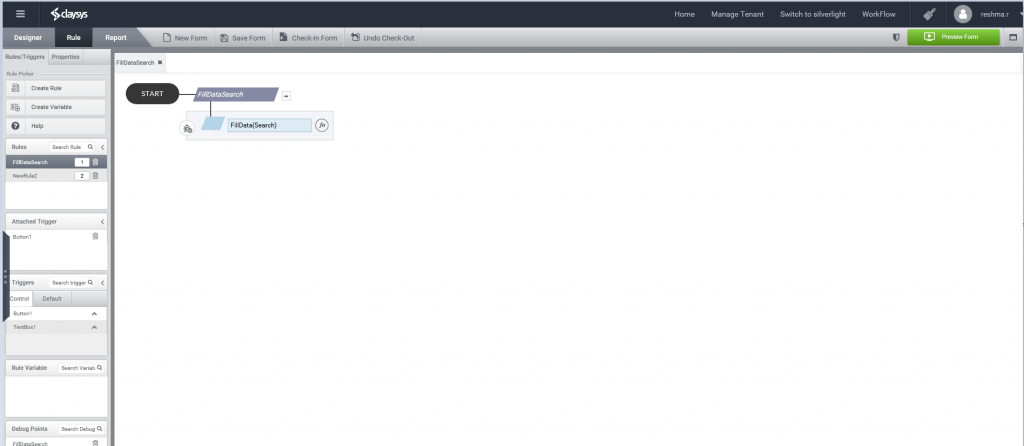
- Once the Debug has been set, it’s been highlighted with ‘Red’ outline (Figure 2).
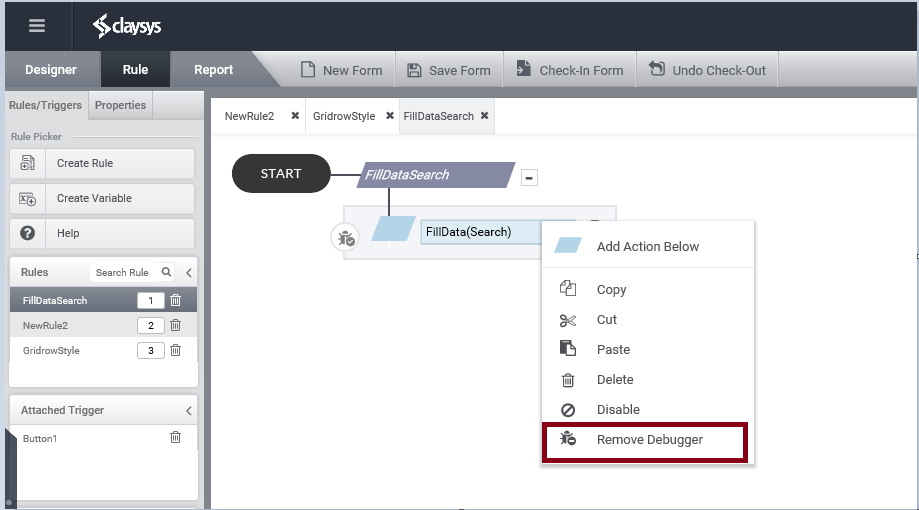
Remove Debugger
- By Right clicking over the rule, which has debugger the user can remove the Debug.
- The user can also use the ‘Debug Points’ from Rule picker tab to remove the Debug Points(Figure 4)
- Debug Point for a particular rule can be removed by selecting the Rule individually.
Rules Debugger – Available options
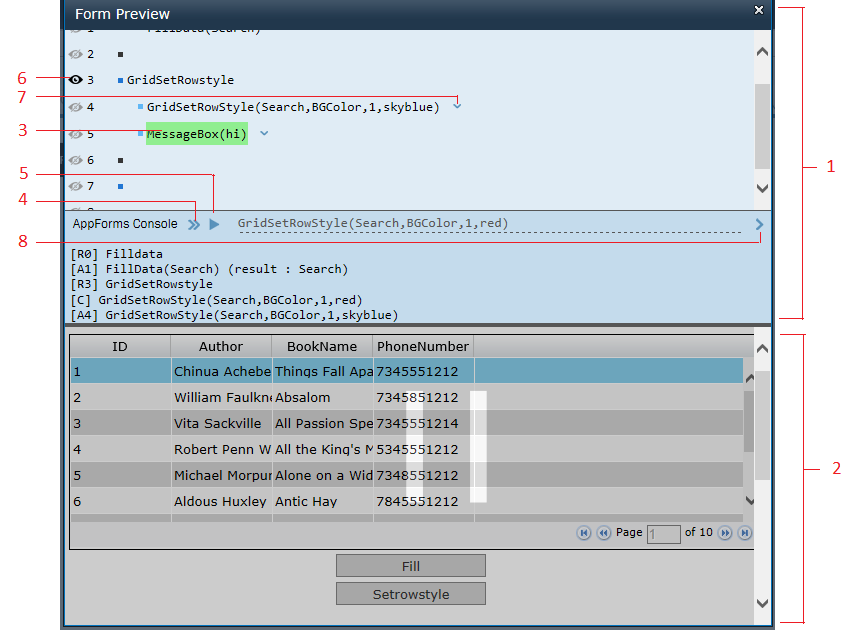
Kindly refer the below image (Figure 5), which explains about the available options in rule debugger.
1. Debugger screen\ AppForms console screen
- In a Form preview, the debugger screen will be displayed right above
the form while executing the rule(Figure 5).
2. Form Preview
- Based on the user actions from “Rule debugger screen” the results will be displayed in Preview below.
- This screen remains inaccessible until the debugging has been completed.
3. Rule which is in process
- The rule which is progress will be highlighted with ‘Green’ color.
4. Navigation towards next steps
- By clicking Next ( ) from AppForm console, the user can able to navigate towards next steps.
5. To execute whole rule
- Using Run ( ) the user can execute the whole rule.
6. Toggle\Debug points between steps
- By clicking the toggle button ( ) the user can Set\Remove the debug points.
7. To copy the expression to command line
- Using copy the expression to command line ( ) the user can able to copy the command to the command line.
8. To execute the copied expression
- Execute command ( ) option or by pressing ‘Enter’ key the user can execute the user defined commands while debugging the form.
- The results for the executed commands will be updated in “Debugger screen” along with its corresponding unique line number.
- The user can able to copy the results by selecting the results obtained.
Commands abbreviations:
R → Rule
A → Action
D → Decision
C → Command (User defined)
Example for Rule Debugger using search control
- Create a new form and drag a search control
- Configure it with the SharePoint data source and add a button trigger to fill the data
- Add another button with the rule to set Background color for a row (Example: Setrowstyle).
- Navigate to the rule and set the Debug points
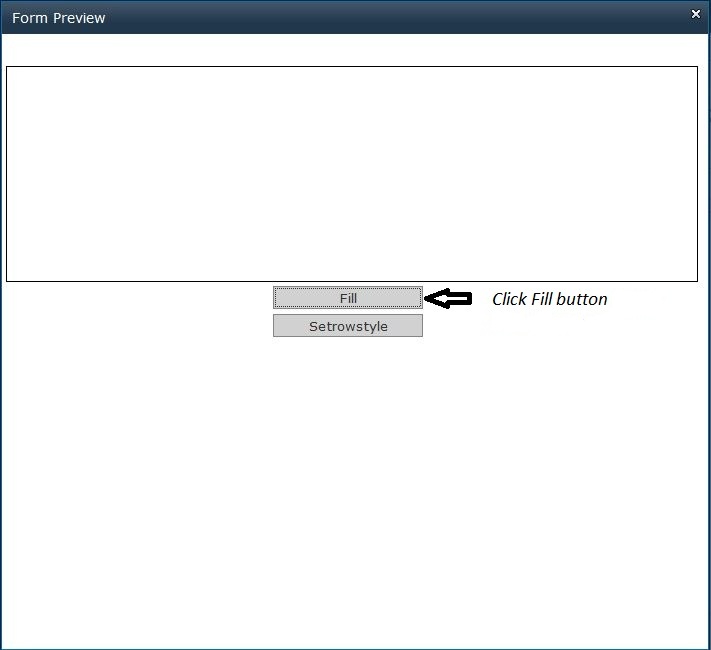
- Click ‘Preview’
- And click Fill button to fill the data in search (Figure 6).
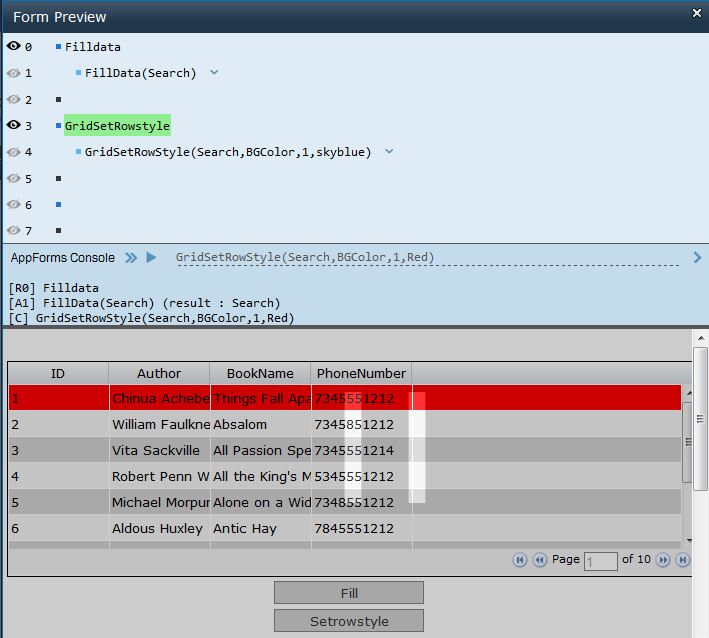
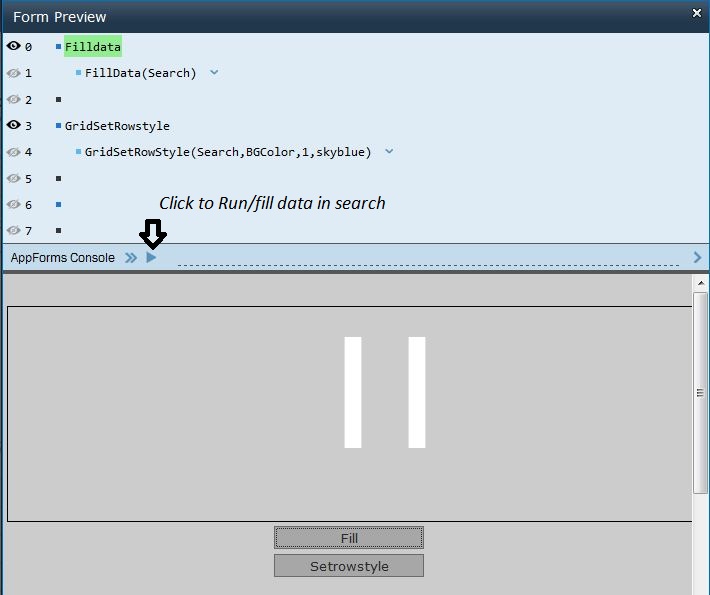
7. The Debug screen will be displayed over the form (Figure 7).
8. Click Run ( ) to fill data in search or click Next ( ) to execute the rule step by step.
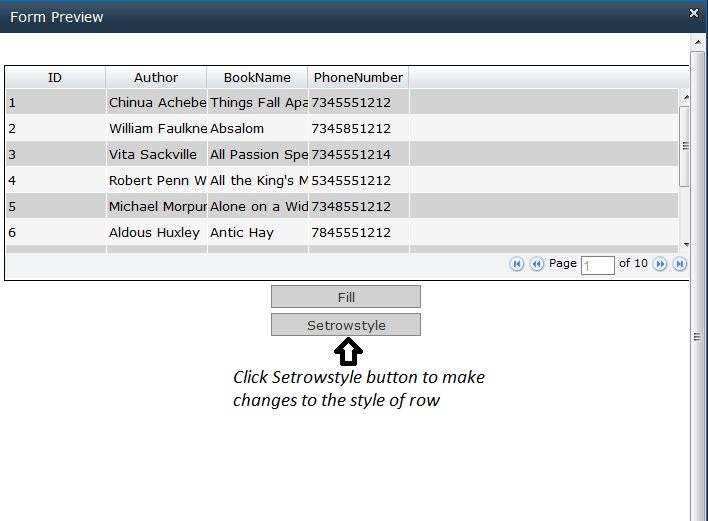
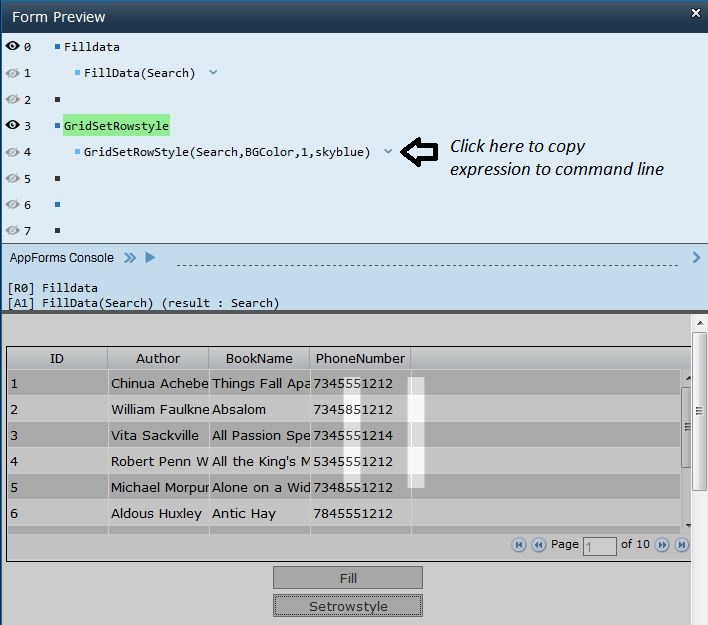
9. Then click the ‘Setrowstyle’ button to trigger the next debug point. The debug screen highlighting the ‘setrowstyle’ will be displayed in the rules debugger screen.
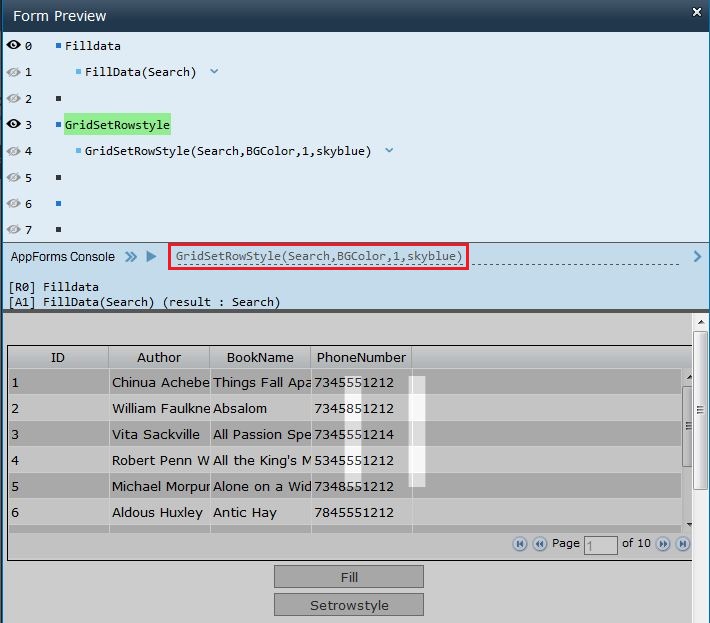
10. Click ( ) to copy expression to the command line.
11. Once the expression has been copied to AppForms Console, the user can edit and run the edited commands by pressing “Enter” key or by clicking Execute command ( ).
12. Based on the commands from the AppForms Console the output will be displayed.
Example: Change the background color to ‘Red’.
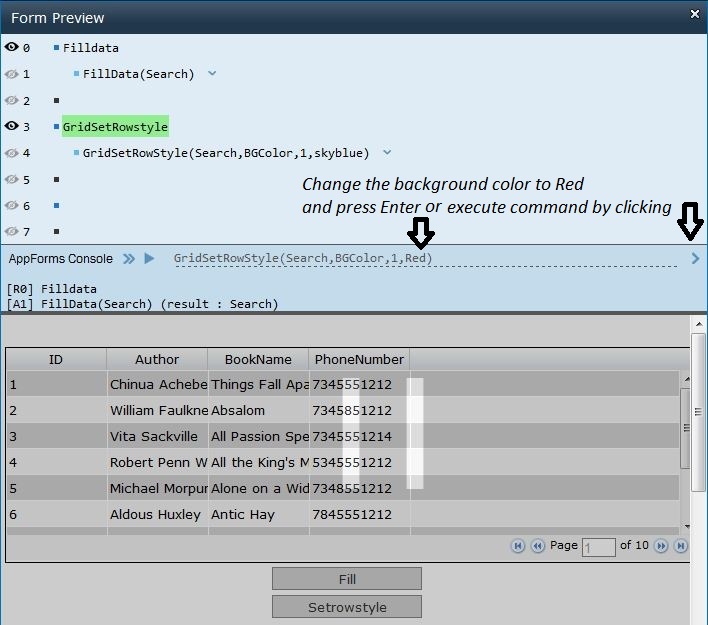
13. Results will be displayed on the form preview.
Note: The commands executed in the command line does not affect the rule defined. Once the user executes the defined rule, the output for the corresponding rule will be displayed.