Robot Details
The Robot tab displays a table containing the Robot Details such as the Robot name, Machine Name, Created By, Status of each robot, Edit, and to view details.
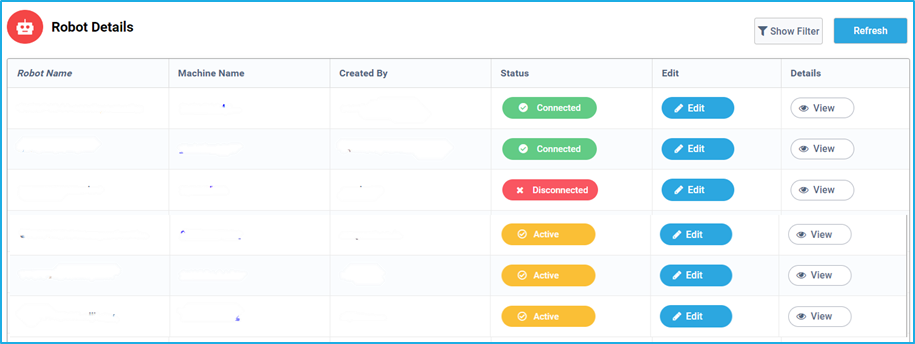
- Robot Name: This column displays the names of the robots that are available in the bot manager.
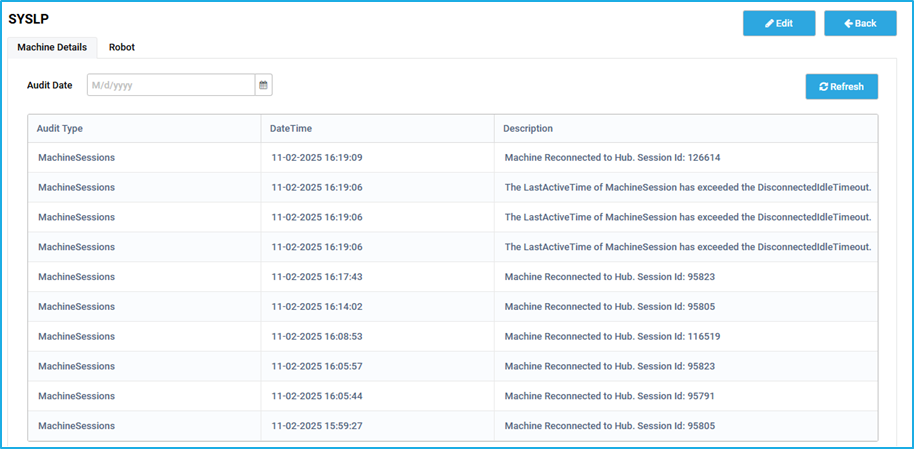
- Machine Name: This column shows the names of the machines which are connected to the corresponding BOTs. On clicking the Machine name, it will navigate us to a window which displays the details such as the machine details and robot status for the particular machine to which the robot is connected.
- Machine Details- This Tab has the complete logs of the Machine events. In the table, the first column displays the AuditType of a particular machine event, second column displays the datetime of that event. The third column shows the description of that event.
- Robot- The Robot Tab shows the Robot name and the current status of that BOT. (Connected/Disconnected).
- Created By: This column displays all the names of the users who are using the BOTs.
- Status: This column displays the current status of the respective robots. The following types of statuses can be seen under the status column:
- Connected: If the bot is connected to the bot manager using a specific service URL, the status will be shown as connected.
- Disconnected: Due to any reason, if the bot gets disconnected from the bot manager, the status will be shown as disconnected.
- Active: Once the copilot is quit from the system tray and the status of RPA Genie agent service is running, then state of the bot will be displayed as active. Note: The Bot need not be changed to the connected state manually if the active status is shown. If a job is scheduled at a particular time, then at the start time of the job, the status of the BOT will be changed to connected automatically with the help of the Auto-Login feature.
- In-Maintenance: If a particular Machine has been selected to undergo maintenance, then the status of all the robots under that machine will be shown as “In-Maintenance”.
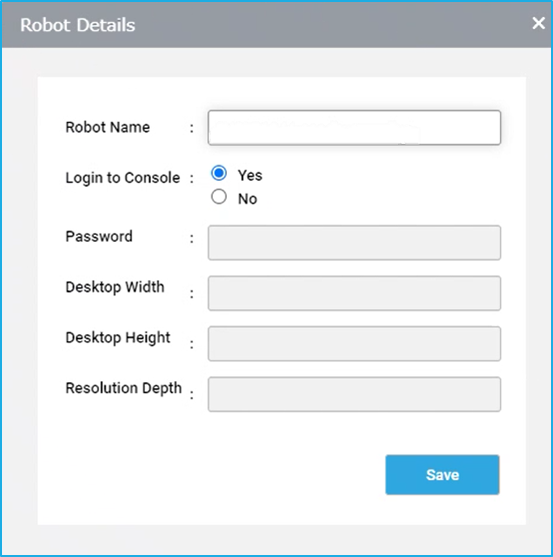
- Edit: On clicking the Edit option of a particular Robot, a window pops up, where the robot settings can be configured.
- Robot Name field allows to edit the name of the robot.
- If the toggle button for Login to console is enabled, then the robot in the server machine has to be in the connected state. Whereas if it is disabled, using the password that the user provided, it will create an RDP session and will run the job via agent service in the server.
- For any UI automation, the window settings such as desktop width, desktop height and resolution depth can be configured.
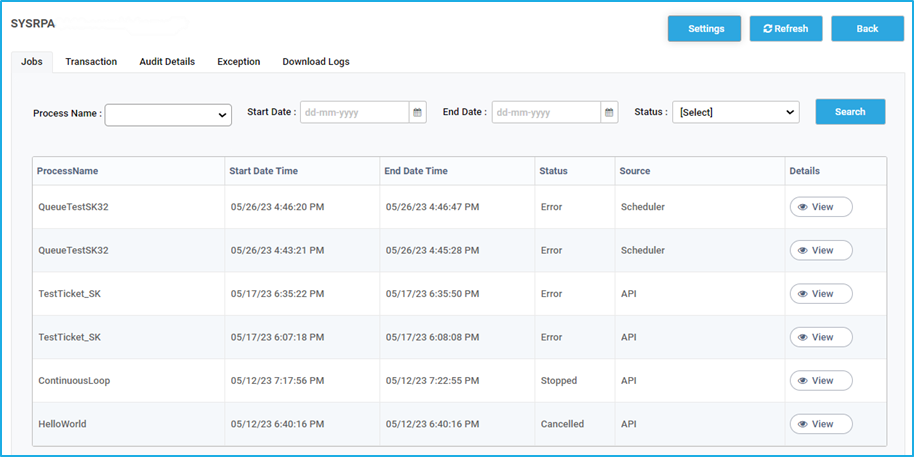
- Details: Once we click on the view option for a particular robot, it takes us to a window consisting of a few sub-tabs. These sub-tabs have filters that can be applied for a quick search. These sub-tabs are as follows:
- Jobs: This tab consists of a table that displays brief details of all the jobs such as Process Name, Start and End Date Time, Status and Source of any job that had been run through this BOT.To have a detailed information about the specific job, click on the corresponding ‘view’ button which will navigate to a window where the user will be able to have an in-depth understanding of additional job details regarding the activities used, transaction items details and exception details, if any. These can be accessed in the below sub-tabs:
- Activities: Displays details about all the activities used for that job and whether those activities are executed or faulted.
- Transaction: The transaction items that have been added to the queue are listed only if the queue is included in the workflow for that specific selected job.
- Exception: If the job gets faulted, then this tab shows the information regarding the DateTime, Source, Type and the Exception message of that exception. On clicking the ‘view’ button next to the exception message, detailed information about the exception can be checked.
- Note: This is the same window that opens up when we click on the view option for a specific job under the main jobs tab.
- Transaction: This tab shows the details of all the Transaction items of each queue that was created to execute queue specific automation using this particular BOT. This table lists details of all the queue items such as reference, queue-name, start and end date time and status for any queue which was created and used by the bot. To have more information of a specific queue item, the ‘view’ option can be clicked to access the certain details such as the activities used, nested transaction, exceptions and transaction item details for any individual queue item.
- Audit Details: This tab has the complete logs of a Robot’s events. In this table, the AuditType column displays the type of the events such as connection, machines, jobs, etc. The table also displays the DateTime and the description of that event (Robot Connected with bot manager/ Robot disconnected with bot manager).
- Exception: The Exception tab shows the complete logs such as Process Name, DateTime, Source, Type and Exception message of all the exceptions that have occurred for any jobs that were executed through this bot. On clicking the ‘view’ button next to the Exception, detailed information about it can be checked.
- Download Logs: In this tab, the start and end date to download the logs can be specified. Also, screenshots and System Information can be included.
- Jobs: This tab consists of a table that displays brief details of all the jobs such as Process Name, Start and End Date Time, Status and Source of any job that had been run through this BOT.To have a detailed information about the specific job, click on the corresponding ‘view’ button which will navigate to a window where the user will be able to have an in-depth understanding of additional job details regarding the activities used, transaction items details and exception details, if any. These can be accessed in the below sub-tabs: