BOT Transactions
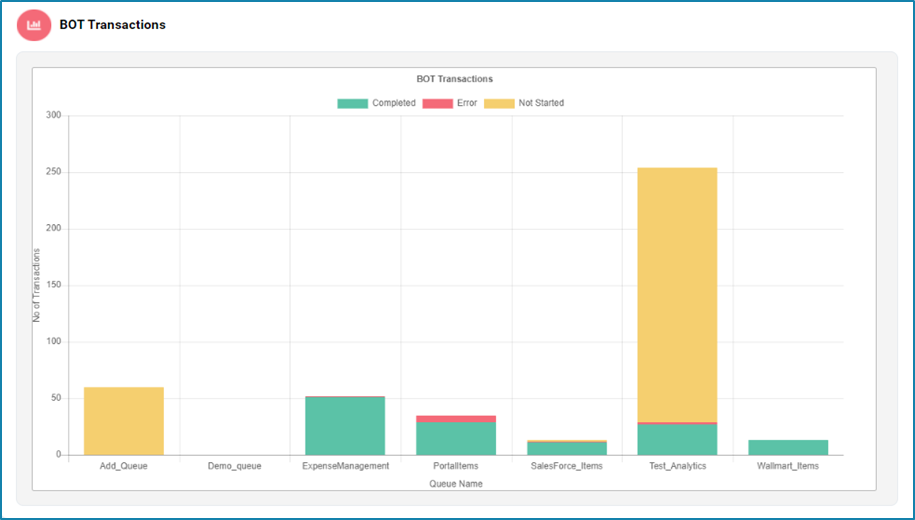
In the BOT Transactions section, users can view the total number of transactions handled by the bots. This data is presented in a bar chart, making it easy to visualize and compare the transaction volumes over different periods or among different bots.
- Horizontal X-Axis typically represents the different bots. Each bar corresponds to a specific bot, labeled accordingly.
- Vertical Y-Axis shows the number of transactions. The height of each bar indicates the total number of transactions handled by the corresponding bot.
- Each bar represents the transaction volume for a particular bot.
This graph helps users quickly identify trends, peak transaction times and overall bot activity levels, providing valuable insights about the bots performance.