BOT Efficiency
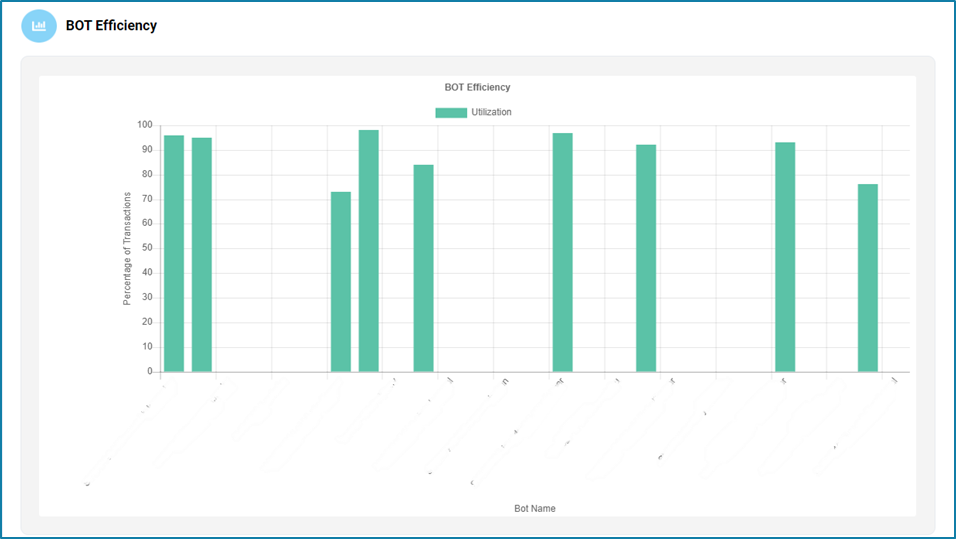
The BOT Efficiency section includes detailed information on the utilization of each bot. Users can see a list of BOT machines and their respective utilization rates, displayed in a bar chart format.
- Horizontal X-Axis represents the different bots. Each bar corresponds to a specific bot, labelled with the bot’s identifier or name.
- Vertical Y-Axis shows the utilization rate (expressed as a percentage). The height of each bar indicates the utilization rate of the corresponding bot.
- Each bar represents the utilization rate for a particular bot.
This graph can help to improve overall efficiency by allowing users to monitor how effectively each bot is being used and identifying underutilized bots.
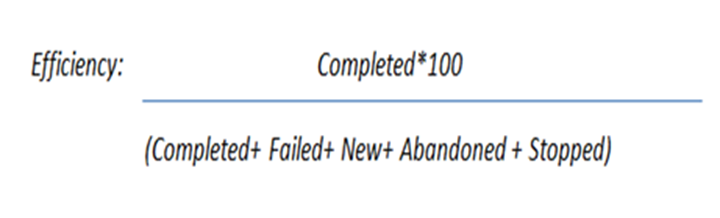
The efficiency of each bot can be calculated using the below equation: