Advanced Debugger
The Debugger feature in AppForms enables users to inspect, pause, and control program execution while providing real-time visibility into variable values, execution flow, and potential errors. It helps users understand application logic, quickly identify issues, improve reliability, and reduce overall development time.
Core Functions of the Debugger
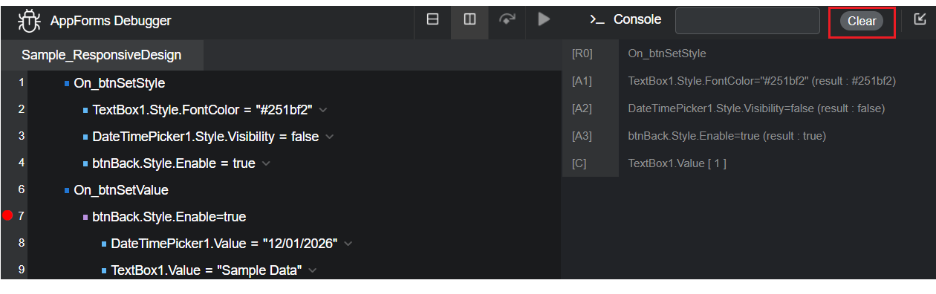
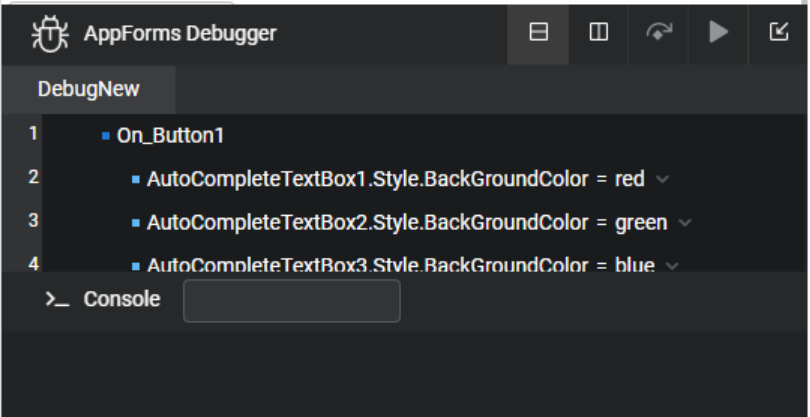
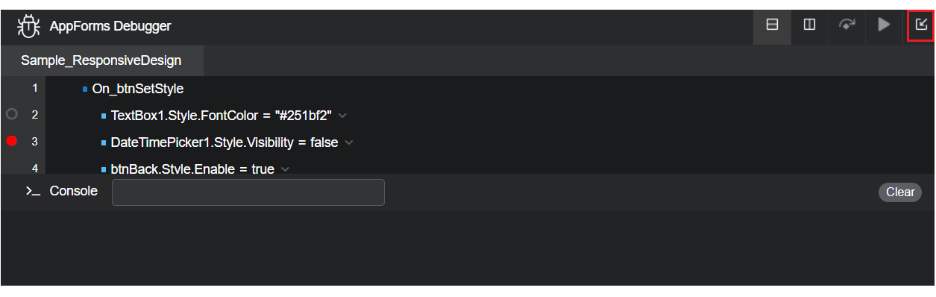
- Set breakpoints to pause execution at specific action in the rule.
- Execute code step by step (Step Over and Resume Execution) to observe how each action is executed.
- Inspect the current values of variables at any stage of execution.
- View the sequence of actions leading to the current state.
- Monitor variables or expressions as the program runs.
- Detect and analyze errors at the moment they occur.
Use Case
- Logical Error Identification: Users can identify errors in logic, conditions, or data handling within rule execution.
- Step-by-Step Execution: Provides a detailed view of how the rules behave on each step.
- Variable Inspection: Allows users to inspect variable values at different execution points.
- Debugging: Users can set breakpoints to pause execution for in-depth analysis.
Steps to Enable the Debugger in Web Parts and Direct Form URLs
- Enable the Debug Mode option available in the Beta version of Tenant Settings.
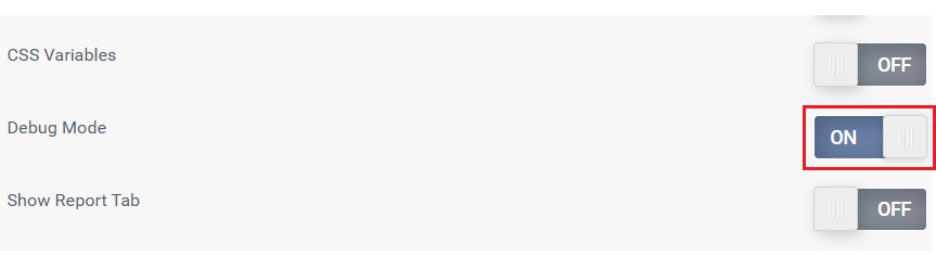
- Once enabled, the Debug Mode option will appear under the Basic Settings section of Tenant Settings.
- Click Manage for Debug Mode and toggle the option ON to activate it.
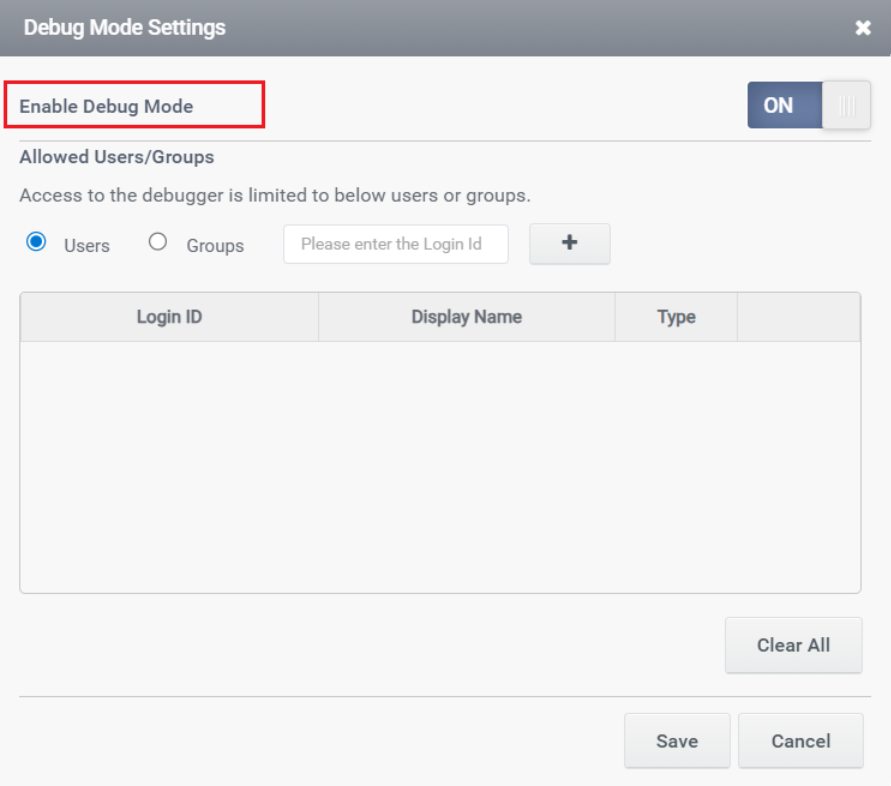
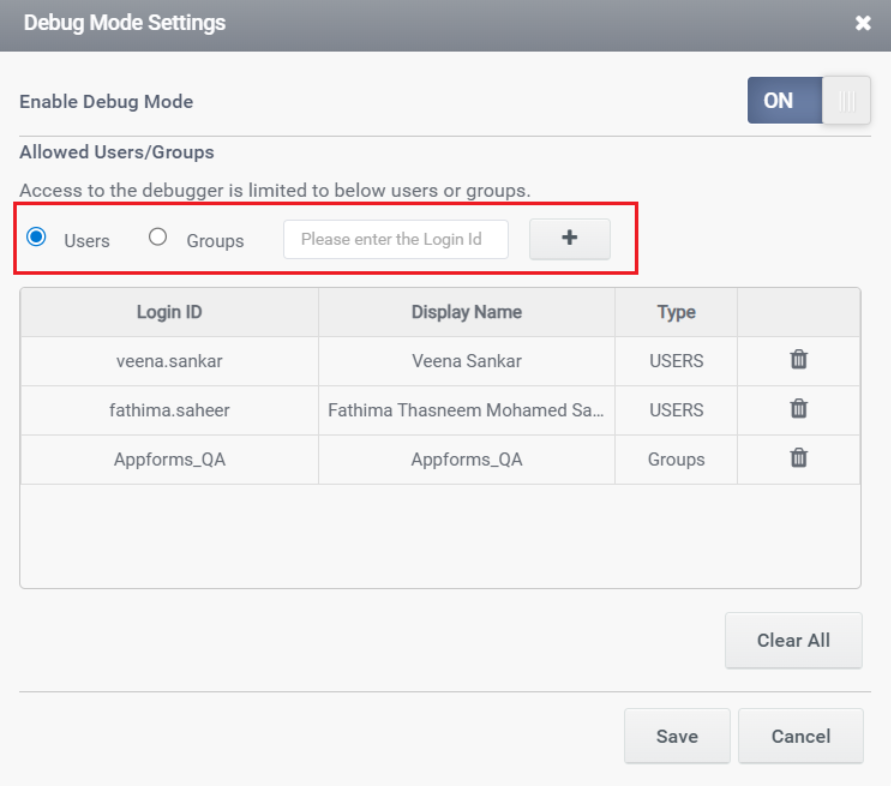
- Add a valid user or group name, then click Save.
Note: The Save button is enabled only after a valid user or group is added. If no user or group is specified, a validation message will be displayed. Only the added users or groups will have access to the debugger.
- Verify that the Debugger is visible in the WebPart and Direct Form URL.

Debugger Functionalities
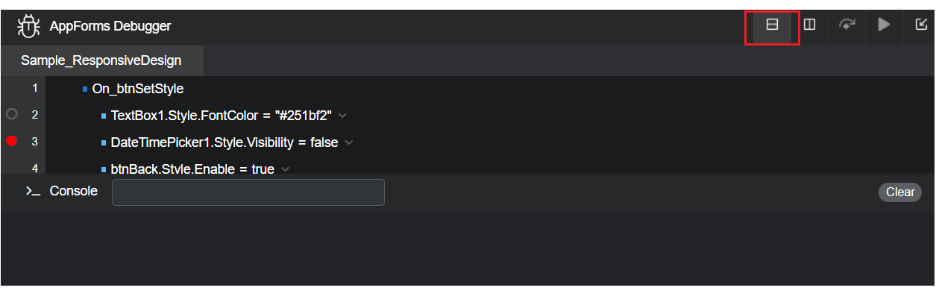
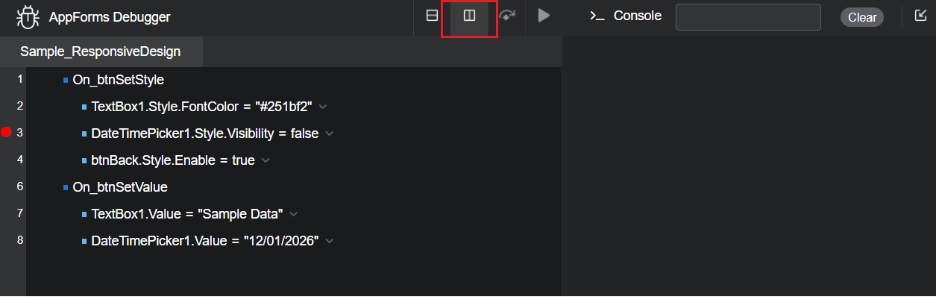
- The debugger supports two views: Vertical and Horizontal.
Users can switch between these views to inspect and use the debugger in the preferred layout.
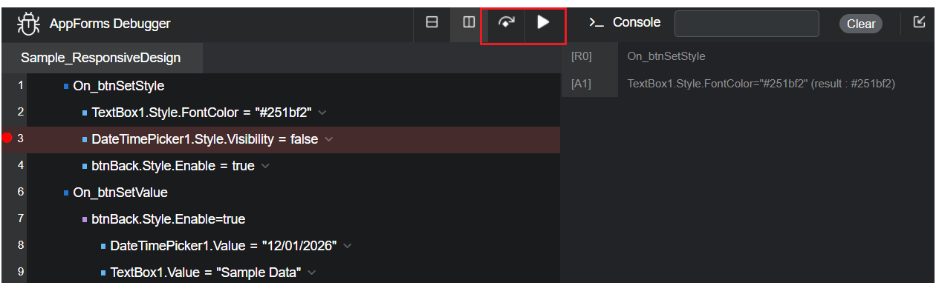
- When a user sets a breakpoint, the rules engine pauses execution at that point. Execution resumes only when the user selects Resume Execution or Step Over.
- The debugger view includes options to minimize and maximize the interface.
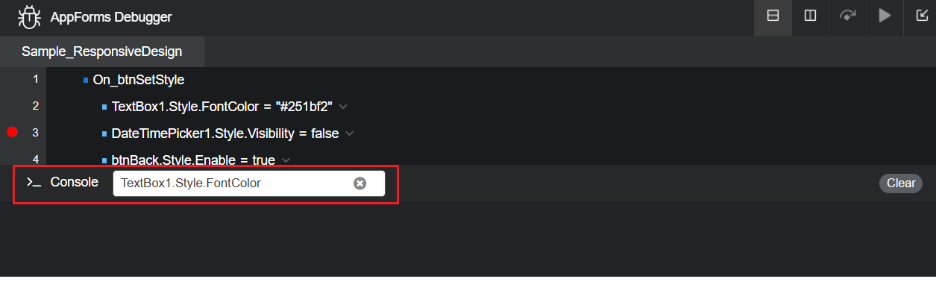
- The Console window provides a text box for dummy testing, allowing users to test actions at any point in execution. Users can also input different values to validate outputs for specific rules.
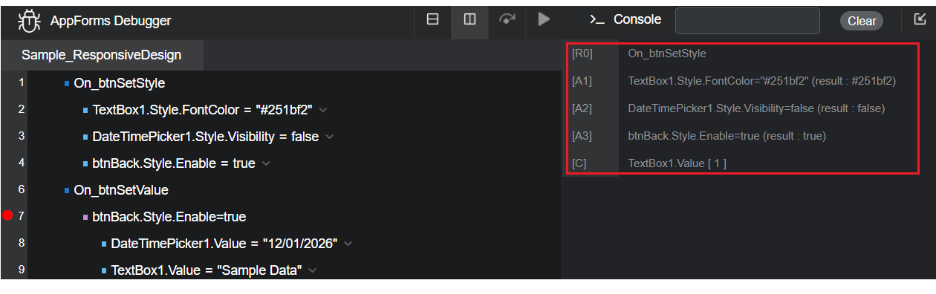
- The Console window displays detailed execution logs, including Actions, Rules and Decisions:
A – Actions
D – Decisions
R – Rules
C – Other console actions
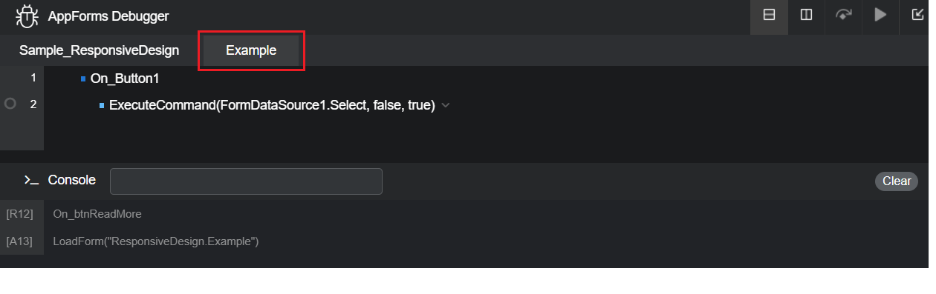
- On loading a form or popup, new forms rules will open in new tabs. The tab will close when the form is closed.
- A Clear button is available in the top-right corner of the Console window to remove all logged data in Console.