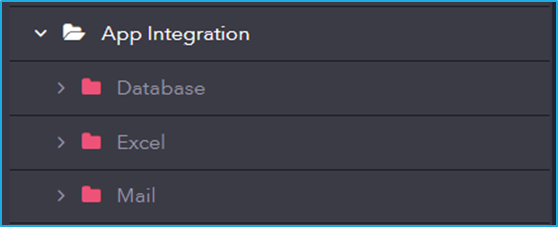
It includes activities for automating tasks by integrating with email systems, Excel files for data manipulation, and databases for managing data operations.
It includes activities for automating tasks by integrating with email systems, Excel files for data manipulation, and databases for managing data operations.
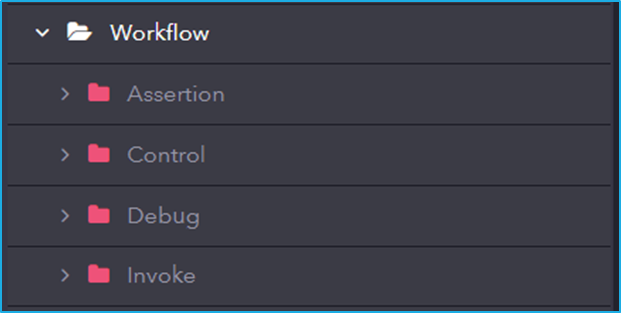
The Workflow includes essential activities that helps manage the execution flow of an automation process. It provides tools to control logic, debug, and modularize workflows efficiently. These activities are crucial for designing structured, scalable, and error-handling-enabled automation solutions.
The URL of the demo project is given below where users can learn about these activities in a better manner.
Steps:
| Activities Used | “Open Browser, Maximize, Select Checkbox, Get Checkbox Selection State, Select RadioButton, Get Radio Button Selection State, Message Box” |
| Video Link | https://www.youtube.com/watch?v=54D8S_f1unw&list=PLwFA5laAhcEJ7sVztHRNXDdXffy2odMvv&index=40 |
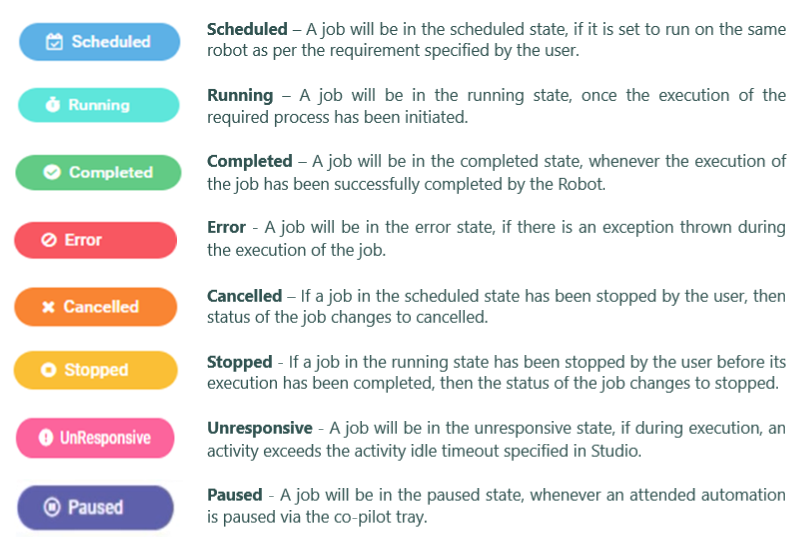
Jobs consist of different states indicating their progress. These states provide users with crucial insights for effective workflow management. The Job states are as follows:
In order to start a Job, the user should add the Process before running it as a Job.
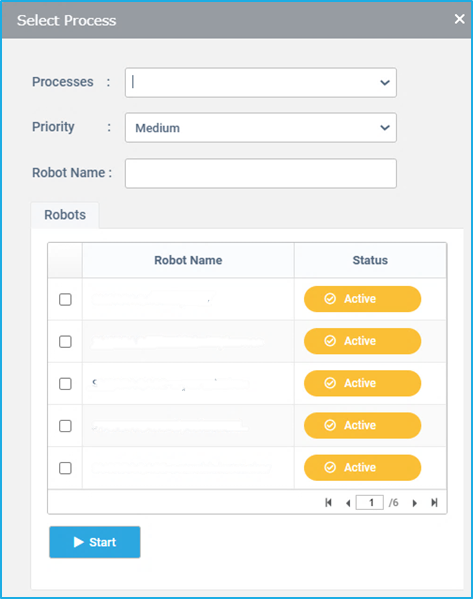
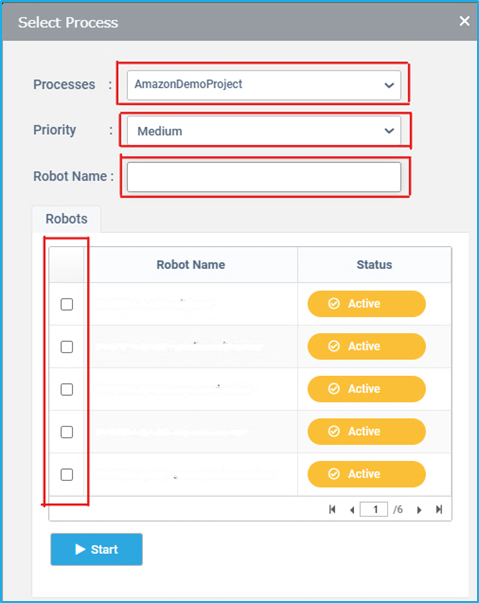
To start/configure a job, the user has to select the desired Process and the bot that is required to run the Process and then proceed with the Start option. The Process will be listed in the Robot Job list with the details such as execution and its status. Additional details such as Activities, Transaction and Logs can also be viewed.
A particular Job can also be launched through a trigger which is used in cases where a scheduled execution is required. Therefore, the Process will be executed as per the desired manner of a user. The user can decide the type of the trigger (Time Scheduler or Queue Scheduler) for running a Job as per the requirement.
Note: Refer to Triggers section for more details
Jobs represent the execution of a process. From the Jobs tab, users can manage the jobs, monitor jobs that had been already launched previously, check their statuses and view their activities, transactions and logs.
The jobs tab displays information regarding all the processes that are scheduled, running and those that were run on the registered bots along with their start and end times. The information column adjacent to each entry provides a brief description of a particular job such as the process name, source, status, etc. If the status of the Job is shown as Error, the error message will be displayed in this window.
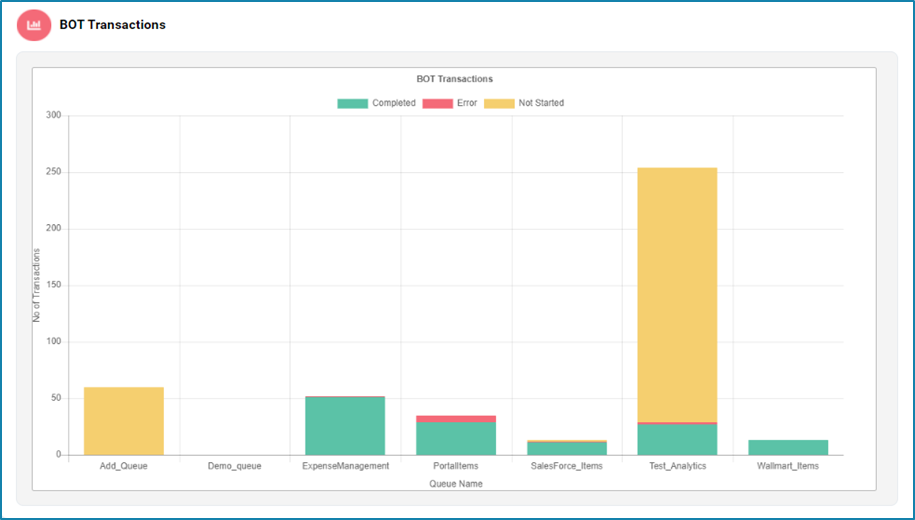
In the BOT Transactions section, users can view the total number of transactions handled by the bots. This data is presented in a bar chart, making it easy to visualize and compare the transaction volumes over different periods or among different bots.
This graph helps users quickly identify trends, peak transaction times and overall bot activity levels, providing valuable insights about the bots performance.
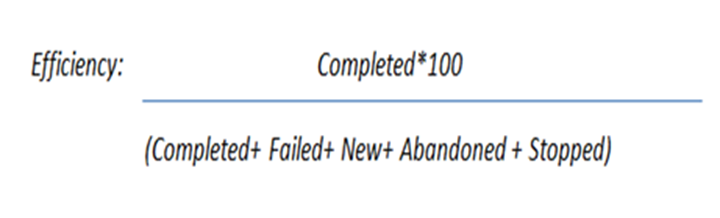
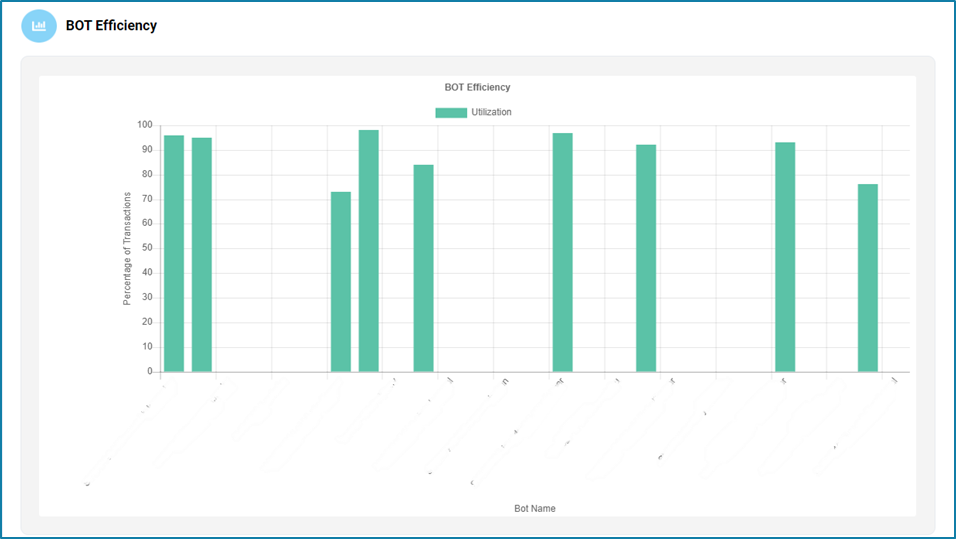
The BOT Efficiency section includes detailed information on the utilization of each bot. Users can see a list of BOT machines and their respective utilization rates, displayed in a bar chart format.
This graph can help to improve overall efficiency by allowing users to monitor how effectively each bot is being used and identifying underutilized bots.
The efficiency of each bot can be calculated using the below equation: