For fast delivery of new business applications, conventional Java and .NET coding is usually no longer your best choice. Instead, a generation of new productivity platforms holds the potential to speed initial application delivery and ongoing updates. These platforms abstract away configuration chores, repetitive coding tasks, and long testing and quality assurance (QA) cycles. Some allow application development and delivery (AD&D) teams to delegate application delivery — in part or in whole — to business experts. AD&D teams under pressure to deliver more with less should evaluate these platforms. This research outlines this emerging category’s benefits and risks.
Read more…
Month: November 2011
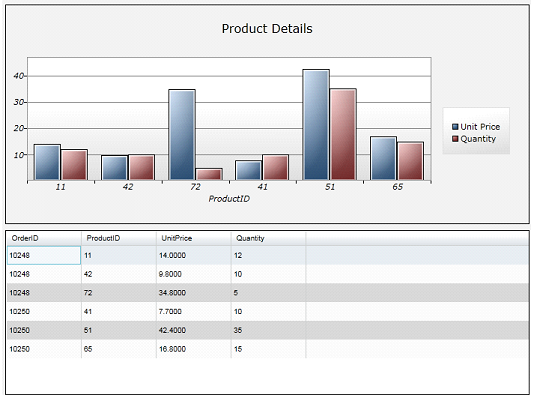
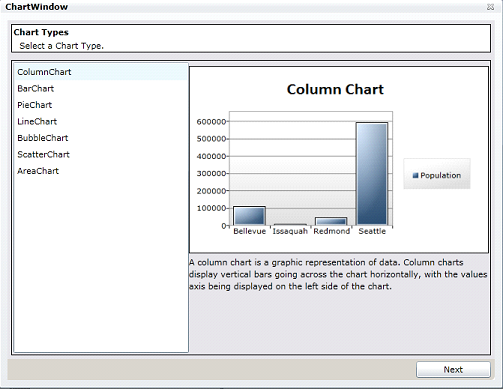
Design Charts Using Chart Control Version 1.1 In AppForms

Chart control is the new control added to the AppBuilder for the reporting purpose. Using this tool the user can design a form with different types of charts and configure its data to be from a search control in the same form.
Designer
- New control will be available in the toolbox in the data section.
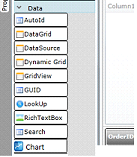
- This control can be dragged onto the form.
- The chart control can be mapped to any of the search control in the form.
- For configuring the chart, click on the items on the property window. On clicking, a wizard will appear.
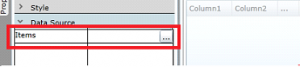
The wizard will guide you the steps for Configuration:
- In first step, you will be asked to select the chart type user want to display.
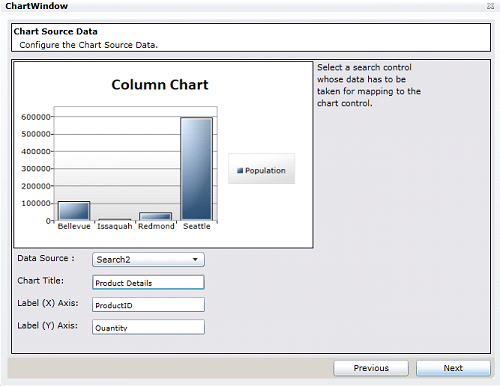
- In the second step, the user can map the search control whose data has to be taken for the report. Also he can give the chart a title and also the X/Y axis labels.
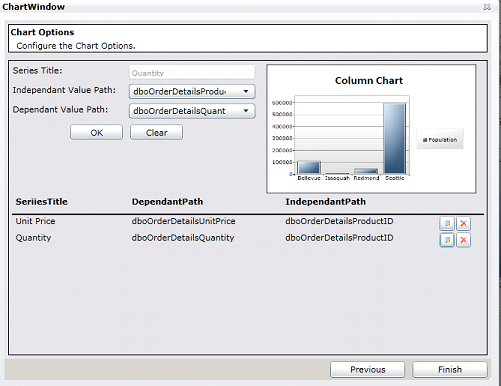
- In the third step, he can add multiple series for the graph. He will be able to edit the existing series as well as delete them. For each series he can give the series title which will be displayed as the legend.
- He can set the IndependentPath (X-Axis) and DependentPath (Y-Axis) to any column of the configured search control.
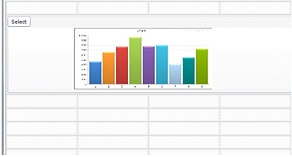
Rendering

- Based on the chart configured in the designer, the rendering engine will generate a chart with the data populated from the search control.
- When the data of search control change, automatically the chart will also get updated.
- The type of chart will be the type, the user has configured on the designer.