Health Monitoring Tool (HMT) consists of two separate services:
RPA Genie Server Agent – This service is dedicated to monitor the connectivity of the Genie Database on the Genie Server side. It can be configured using the Administrative Console Tool, which is installed alongside the Genie Service Installer.
Genie Agent Service – This service is dedicated to monitor the connectivity of the Genie Service. It can be configured during the Studio installation.
Previously, a single service monitored both the Genie Database and Genie Services. Now, this functionality has been split among these two separate services. Both services will run in the background like standard Windows services. If any connection issues arise with the Genie Database or Genie Services, the user will receive an email notification. This email will be sent based on the SMTP settings configured in the Bot Manager. Hence, HMT enhances user responsiveness to connection issues by sending email notifications, making issue resolution more efficient.
Output
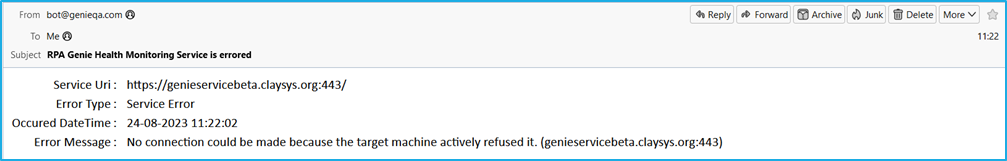
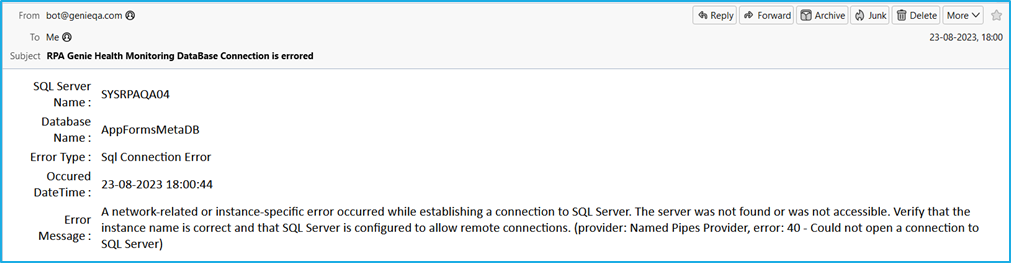
Below are the sample error messages sent via email:
The RPA Genie Health Monitoring Tool is a built-in feature of the Genie application, used to monitor the Genie service connections.
Note: Previously, the RPA Genie Health Monitoring Tool was used for monitoring purposes and had to be installed separately. Starting from version 8, the Genie Health Monitoring Tool is deprecated, and an inbuilt Health Monitoring Feature is provided instead.
Health Monitoring Features
The user needs to configure the Agent Service Monitoring during the Studio installation.
Client-side Monitoring
The Genie Agent Service on the robot machine will be used to monitor the Genie Service connectivity. This can be configured during the Studio/Runtime installation.
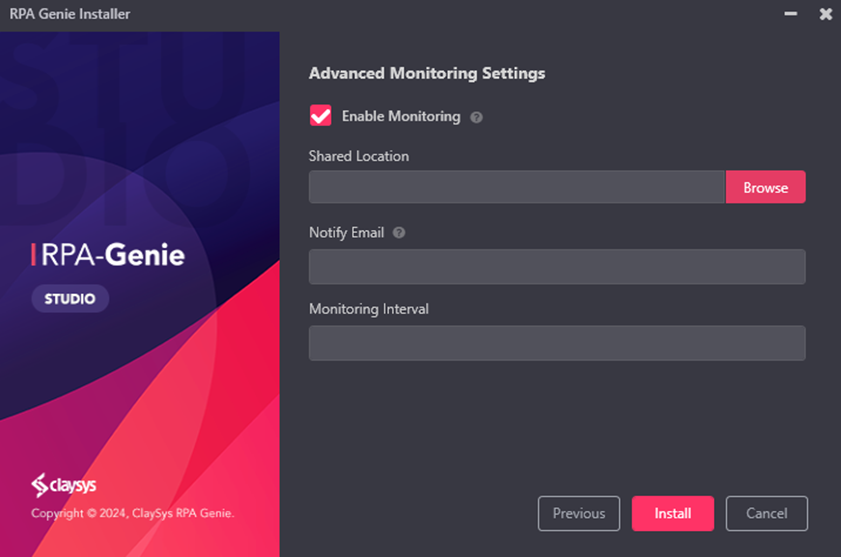
To monitor Genie Service connectivity, the user needs to check the “Enable Monitoring” checkbox. Once monitoring is enabled, provide the necessary details required for monitoring, as listed below:
Shared Location: Specify the location where the monitoring settings files are stored.
Notify Email: Specify the email ID(s) to which notifications need to be sent when the service is down.
Monitoring Interval: Specify how often to monitor the service. This must be provided in minutes.
Below is an example of how the details will be saved in the agentservice.settings.json file in the shared location path .
After entering all the required details, users can proceed with the installation.
Server-side Monitoring
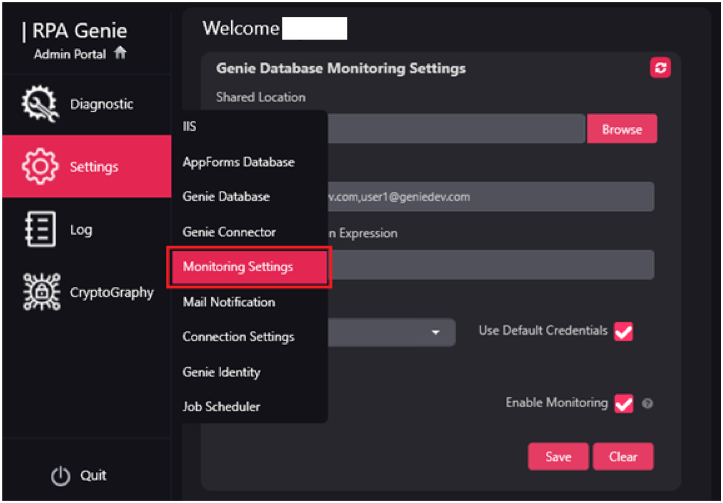
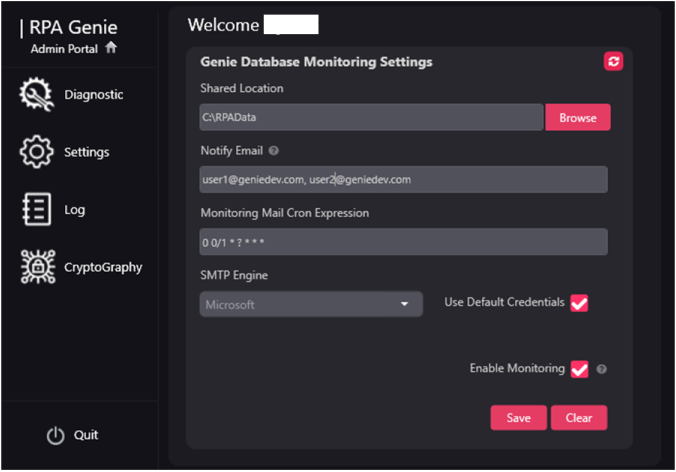
Genie server monitoring is dedicated to overseeing the Genie database connectivity on the server side. This can be configured in the ‘Monitoring Settings’ window in the Administrative Console Tool, which is installed along with the Genie Service Installer.
Server Agent Monitoring can be enabled by selecting the ‘Enable Monitoring’ option. Once enabled, the necessary details required for monitoring must be provided as follows:
Shared Location: Specify the location where the monitoring settings files are stored
Email: Specify the email ID(s) to which notifications need to be sent when the service is down.
Monitoring Mail Cron Expression: Define the schedule for executing tasks in the monitoring system using a cron expression.
SMTP Engine: It is used to send email notifications from the system. It allows the configuration of the email server settings, such as the server address, port, and authentication credentials.
Use Default Credentials: Enable this checkbox to allow the system to use predefined credentials for authentication.
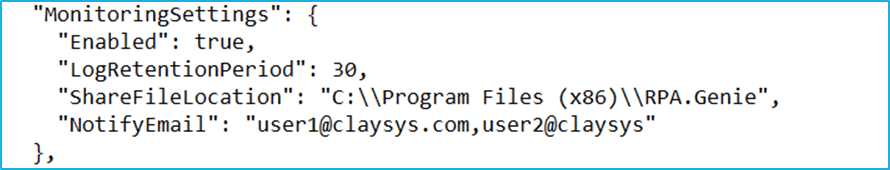
Below example shows how the details will be saved in the appsettings.json file located in the Shared Location path.
The user can continue with the installation after providing all the necessary information.
This is a tab where information about all other Bot Manager tabs is available. In this tab, the user can Inspect and review the changes performed in the Bot Manager. This feature ensures a high level of transparency, allowing all users to see exactly what has been altered and by whom. Hence, it helps to prevent unauthorized or unintended changes.
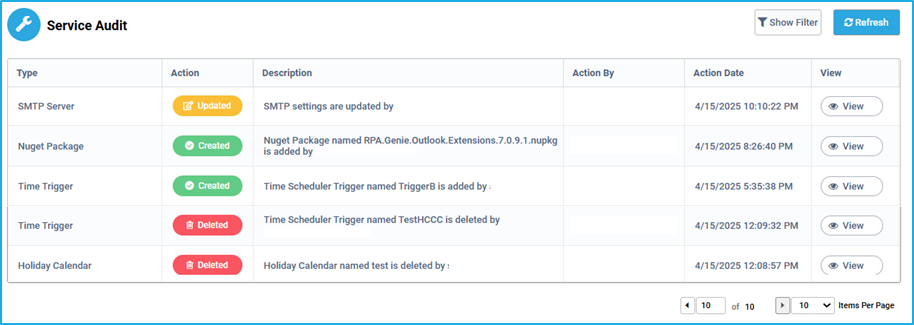
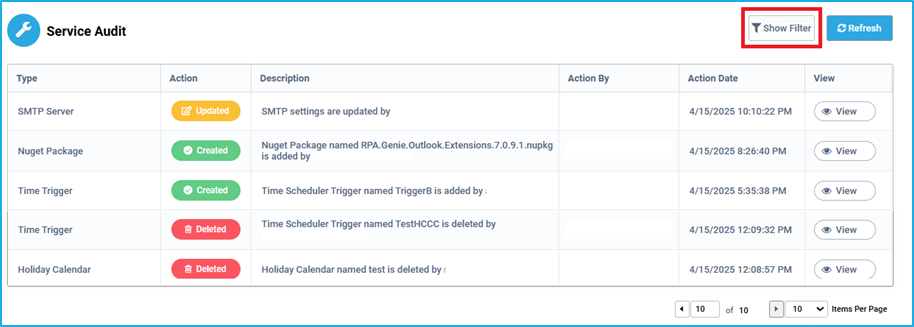
The Audit Details section in the Bot Manager displays a Service Audit table consisting of details such as Type, Action, Description, Action By, Action Date and view.
The ‘Type’ column represents the features in the Bot Manager in which the user has performed an action such as BMT settings, security, Packages, Processes, Queues, Triggers, etc.
The ‘Action’ column indicates the actions performed by the such as Created, Updated and Deleted.
The ‘Description’ column provides a short description of the event based on the type.
The ‘Action By’ column displays the user name of the person who has performed a particular action.
The ‘Action Date’ column shows the date and time on which the action was carried out.
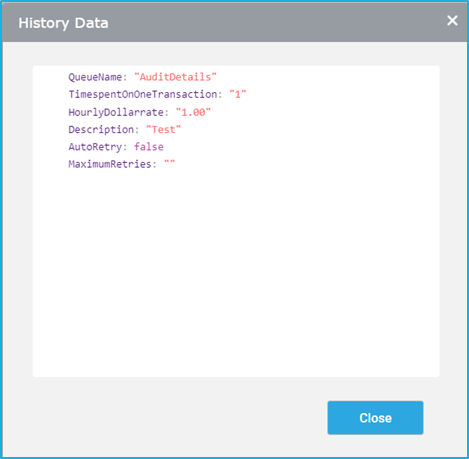
In order to view what is the exact action/event that has occurred in terms of creation, updation and deletion for a particular feature, the user needs to click on the ‘View’ button. It will then be redirected to a window called “History Data” where all the details regarding that particular type of action can be viewed.
Example: History Data for the type “Queue”
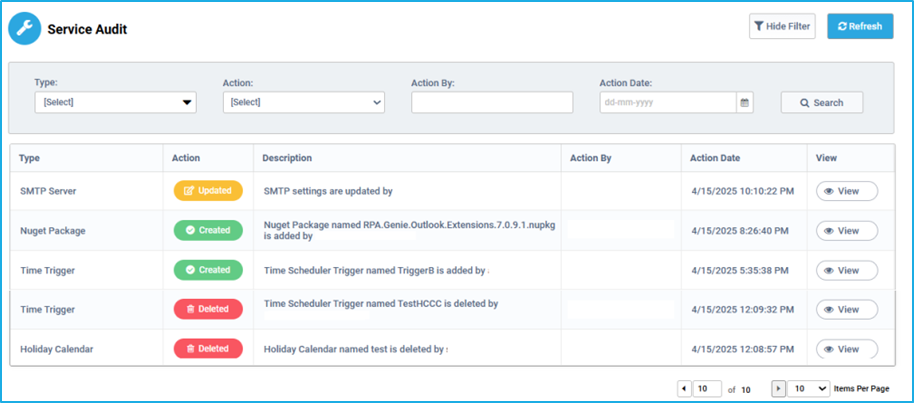
Using the ‘Show filter’ option, the user can filter the service audit details based on the Type, Action, Action By and Action Date.
The “Search” button can be clicked after entering the required data in the respective field(s).
The “Refresh” button helps to reload the tab so that the user can see the latest service audit details.
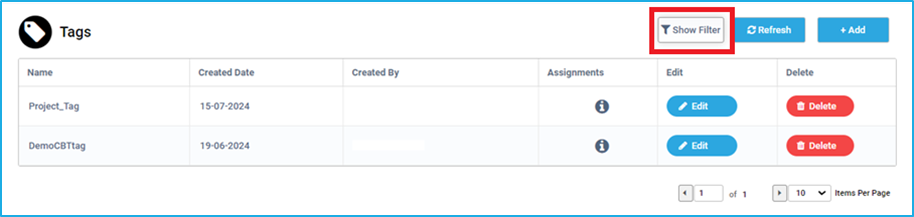
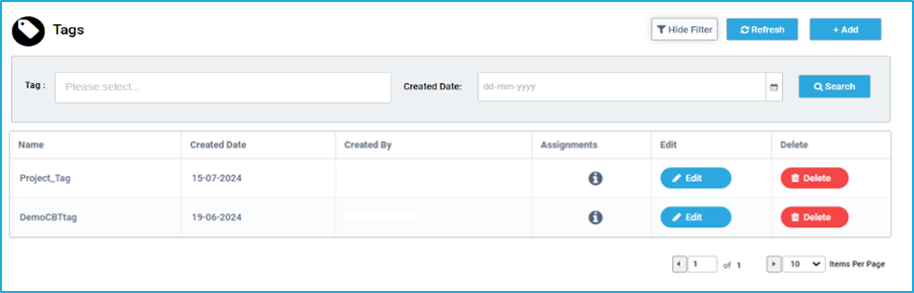
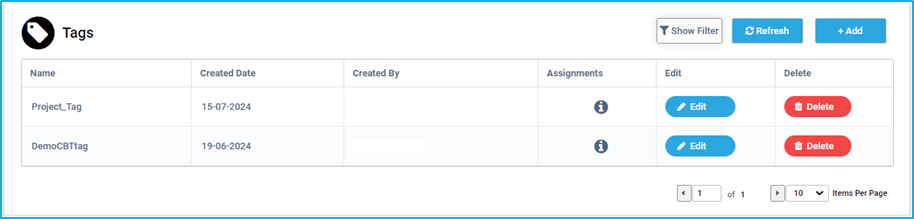
Using the ‘Show filter’ option, the user can filter tags based on the Tag name and Created Date.
The “Search” button can be clicked after entering the required data in the respective field(s).
The “Refresh” button helps to reload the Tags tab so that users can see the latest resource details.
Note: The created tag can be utilized in the ‘Show Filter’ option across other tabs in the Bot Manager. This allows users to use the tag name as a filter to easily locate the associated feature.
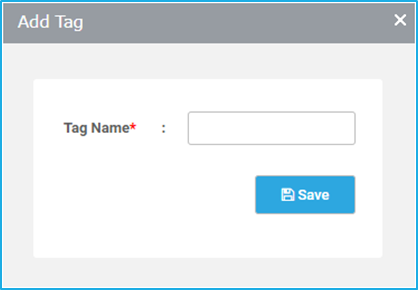
The ‘Add Tag’ window will appear allowing users to provide the Tag name.
Then click on ’Save’. It will then be displayed in the Tags window.
In order to assign any of the specific features (Resources, robots, Triggers, etc.) to a particular tag that was created, there is a section in each of them to add an existing tag name.
Note: Single/ Multiple tags can be added either while creating a specific feature or editing it.
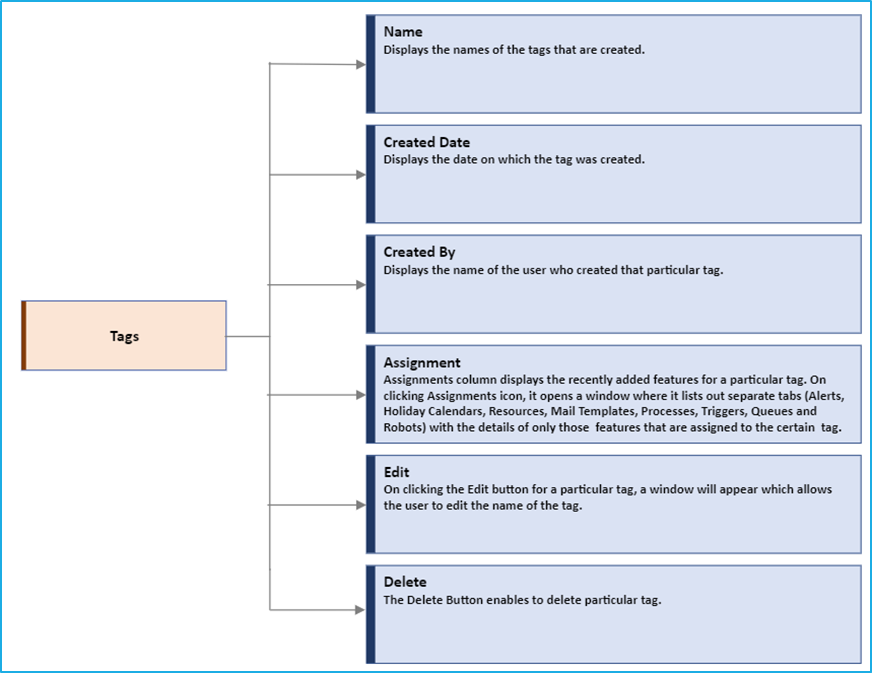
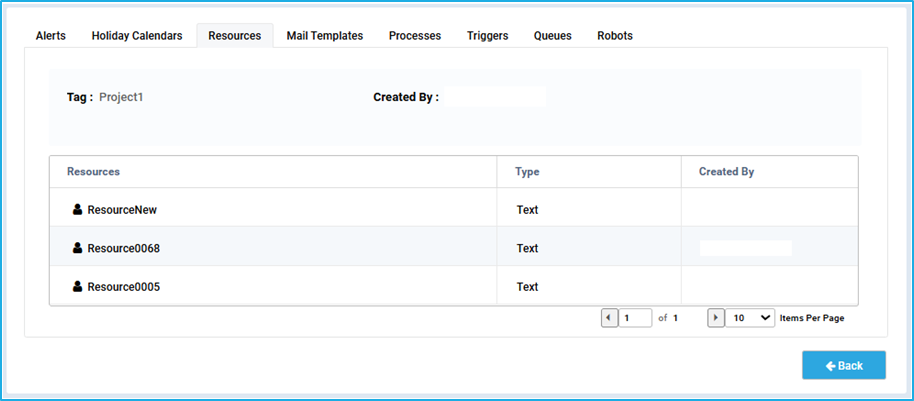
On assigning a feature(s) to a specific Tags, it can be accessed in the ‘Assignments’ column of the Tags tab. This will open a new window listing out separate sub-tabs for Alerts, Holiday Calendars, Resources, Mail Template, Processes, Triggers, Queues and Robots. These tabs display the details of only those features that are assigned to a certain tag.
Tags enable users to filter out or search for several features of the bot manager more efficiently. Without tags, searching for associated features of a particular process is difficult.
The tag has to be created using an appropriate name so that the tag name can be used in the filter option for specific features such as alerts, holiday calendars, resources, mail templates, processes, triggers, queues, and robots.
Example: There may be several numbers of processes maintained in the Bot Manager. Each may have many dependencies like Jobs, Queues, Resources, Etc. Without tags, it can be difficult to search for certain dependent/associated features of a particular process. Hence, Tags can be used to group similar kinds of features.
Tags can be accessed under BMT Settings in the Bot Manager. The landing page of Tags displays a table containing the Tag Name, Created Date, Created By, Assignments, Edit and Delete Columns.
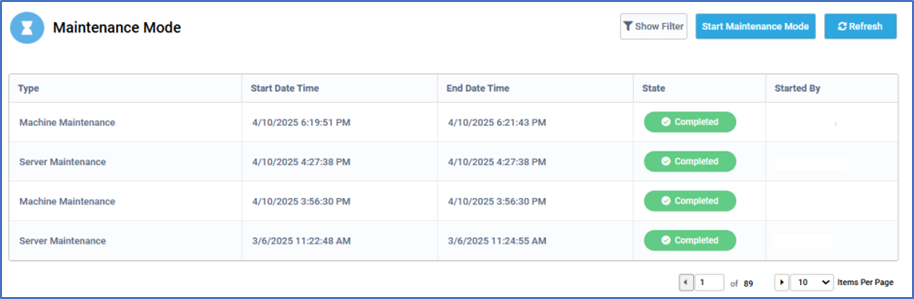
Maintenance Mode can be found inside the “BMT Settings” dropdown menu.This feature enables users to take the Robot and Server offline. It provides an option to temporarily stop all the activities occurring either in the Robot or the Bot Manager Server for the purpose of Maintenance.
The Maintenance Mode tab displays a table showing details such as Type, Start Date Time, End Date Time, State and Started By.
There are two different types of Maintenance Mode:
Machine Maintenance: All Robots connected to a particular machine will undergo maintenance.
Server Maintenance: This will temporarily bring down the specific Bot Manager environment and no activities can be performed
Maintenance mode has three main states:
Initialized: This state specifies that the maintenance has been started in a particular machine or server.
In-Maintenance: The status of the machine/server will be shown as “In-Maintenance” if a particular machine/server has been selected to undergo maintenance.
Completed: This state specifies that the maintenance has been completed in a machine or server.
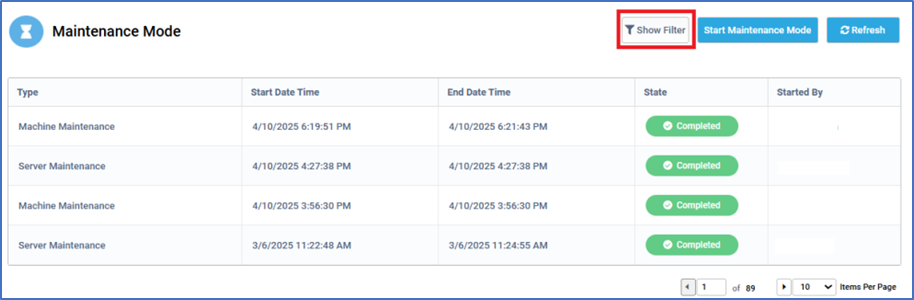
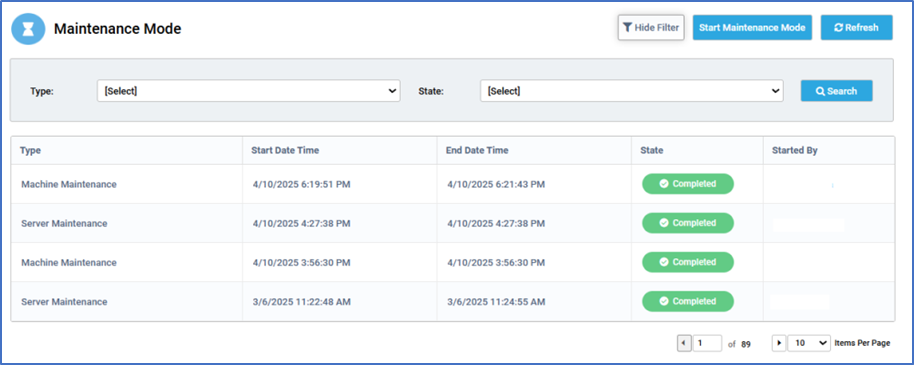
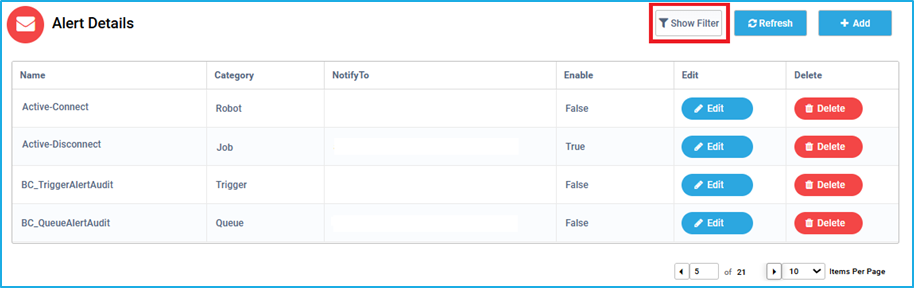
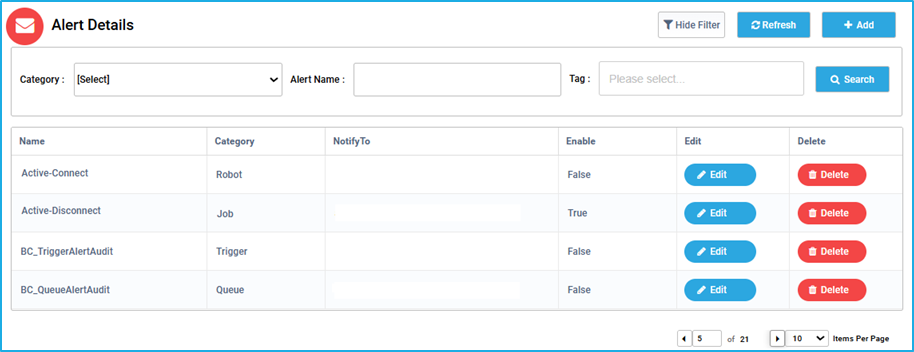
Show Filter
Using the ‘Show filter’ option, the user can filter the maintenance based on the Type and State.
The “Search” button can be clicked after entering the required data in the respective field(s).
The “Refresh” button helps to reload the tab so that the user can see the latest created Maintenance Mode details.
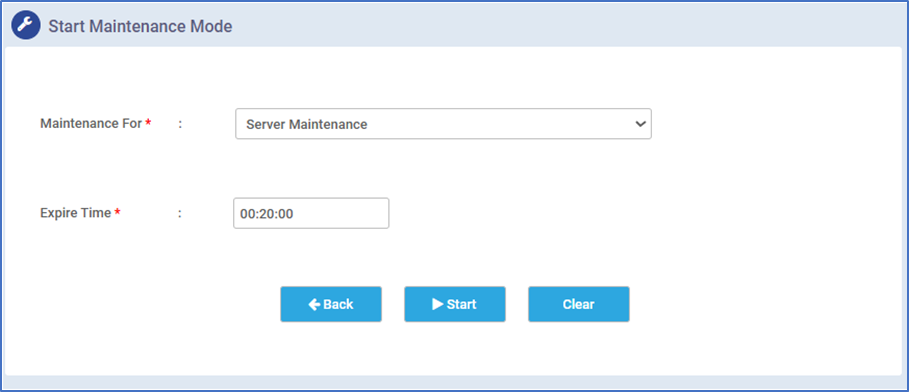
Steps to start maintenance mode:
Click on the “Start Maintenance Mode” button.
In the new window that will appear, select either Machine Maintenance or Server Maintenance the requirement for the maintenance.
Server Maintenance
If the “Server Maintenance” option is selected then, enter the amount of time needed for server maintenance in the ‘Expire Time’ field
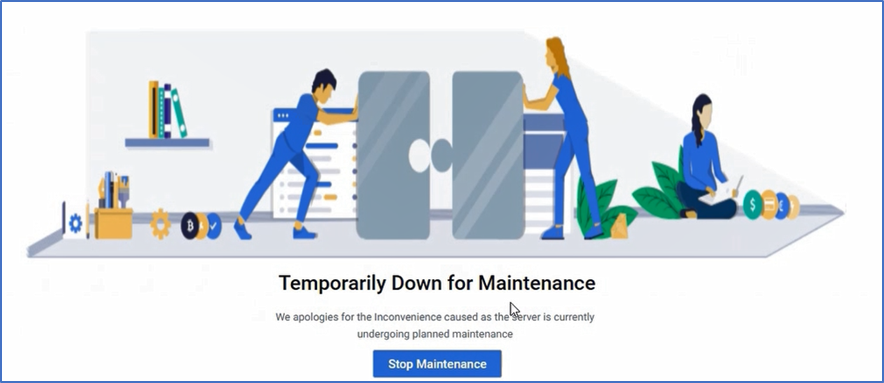
Click on the “Start” button. A message will be displayed as shown below:
Note: The “Stop Maintenance” option displayed in the above image will only be available to users with Admin privileges.
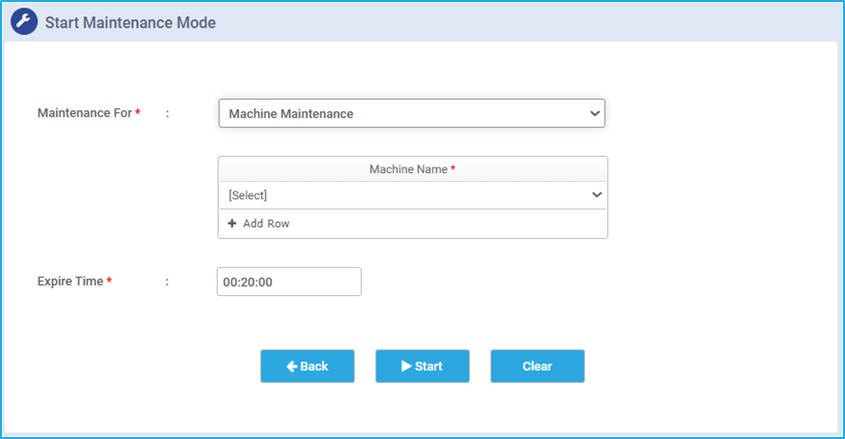
Machine Maintenance
If the “Machine Maintenance” option is selected then, select the machine(s) under the ‘Machine Name’ field and enter the amount of time needed for machine maintenance in the ‘Expire Time’ field.
Click on the “Start” button.
As the Maintenance Mode is initiated, it displays the state as ‘In-Maintenance’. Once, the Expire Time is elapsed and the maintenance for that machine is over, the ‘In-Maintenance’ state will change to ‘Completed’.
Note: The user will not be able to start any job through a robot that is connected to a machine while it is in Maintenance Mode. Also, no user can halt the robot maintenance. Robots will normally be brought back to a functional state after the ‘expire time’ has elapsed i.e. after the maintenance is finished.