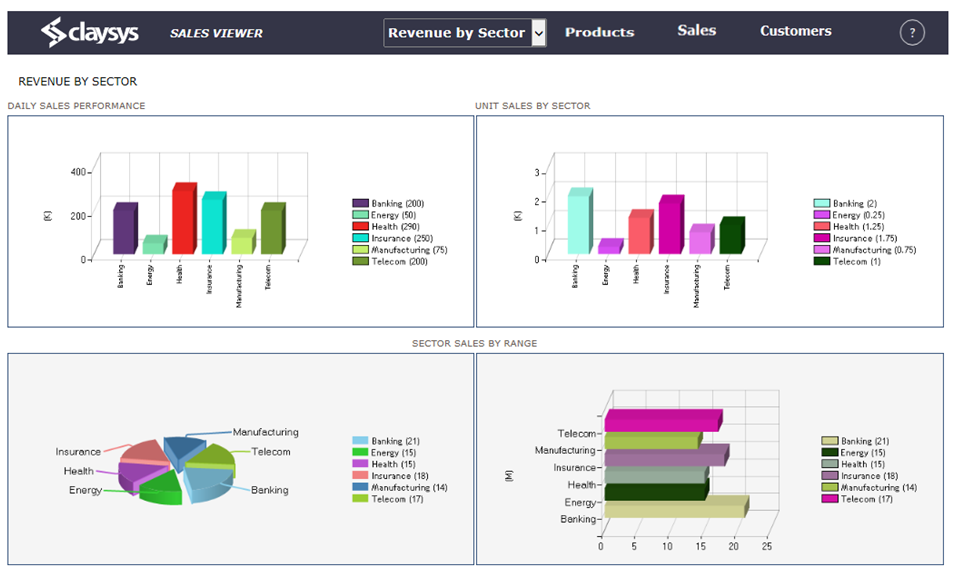
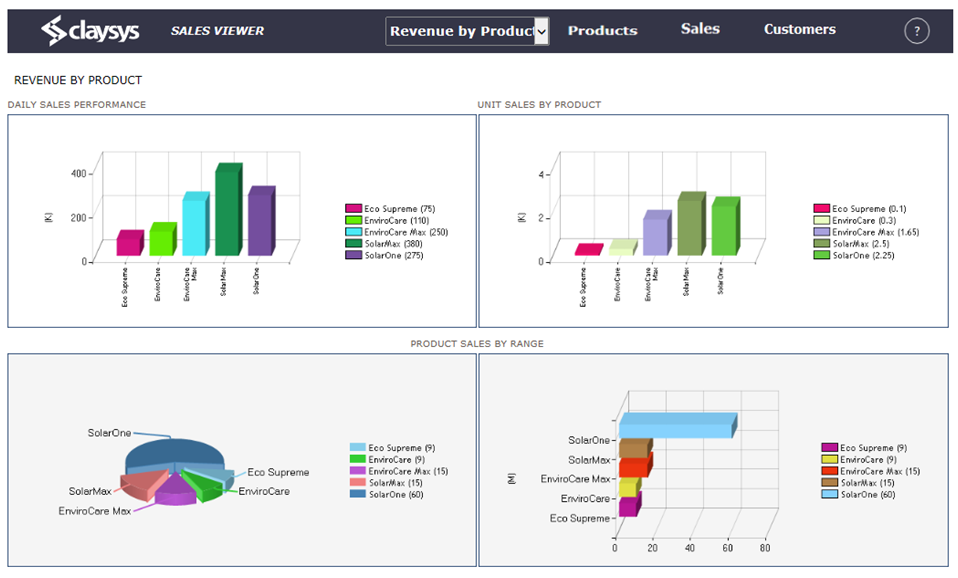
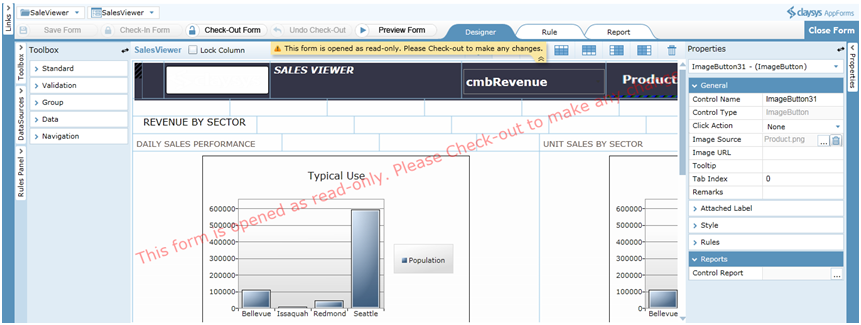
Sales Viewer has been designed to generate graphical reports on Daily sales performance, unit sales and sales by range on the basis of Revenue by sector and Revenue by product. The purpose of this template is designed to be a reference for any person wishing to implement or any person interested in the architecture of sales viewer for the ClaySys AppForms. In ClaySys AppForms Sales Viewer, a combobox is available to select the category. If we select the category as Revenue by sector, the statistical report will show the Daily sales performance, unit sales by sector and sector sales by range as shown in the figure.
- SharePoint 2013
| SharePoint List | |||
|---|---|---|---|
| List Name | Column Name | Data Type | |
| Sales Viewer
‘Sales Viewer’ list is used to configure a search control. Based on the values in this search control, the graphical data in chart control is presented. |
UnitSales | Single Line of text | |
| Dashboard | Single Line of text | ||
| Range | Single Line of text | ||
| Title | Single Line of text | ||
| DailySales | Single Line of text | ||
| List Of Forms Used | ||
|---|---|---|
| Name | Functionality | |
| SalesViewer Form Design Rule Design | ‘SalesViewer’ Form is used to present data in a graphical format with respect to the values in the sales viewer list. | |
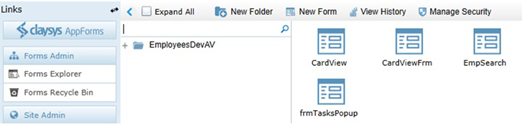
On clicking the New Folder option, it will create a new folder and the name will be in the edit mode. You can type a new name for the folder.
Then click on the ‘New Form’ link on the toolbar. Give an appropriate name for the form. Click ‘Save’ to save the form.
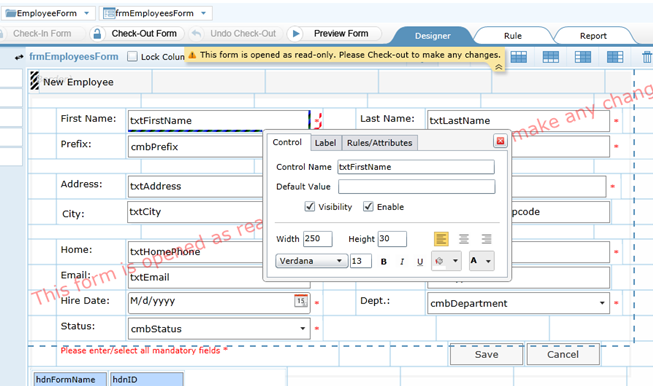
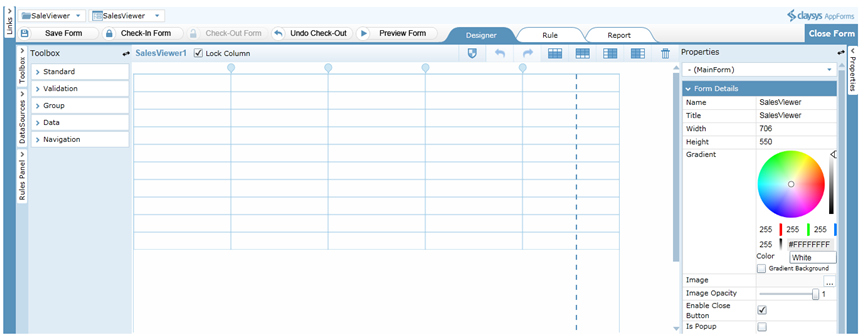
You can drag and drop controls and format the styles easily.
‘Check-In Form’ to save the changes and publish to get the completed form for the end user to use. A form must be checked-out to make modifications while all aspects of the form can be examined while checked-in.
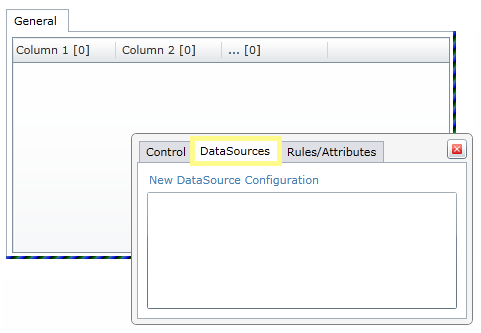
Following steps will explain about the DataSource configuration of Search control. Click Search control select the New DataSource Configuration.
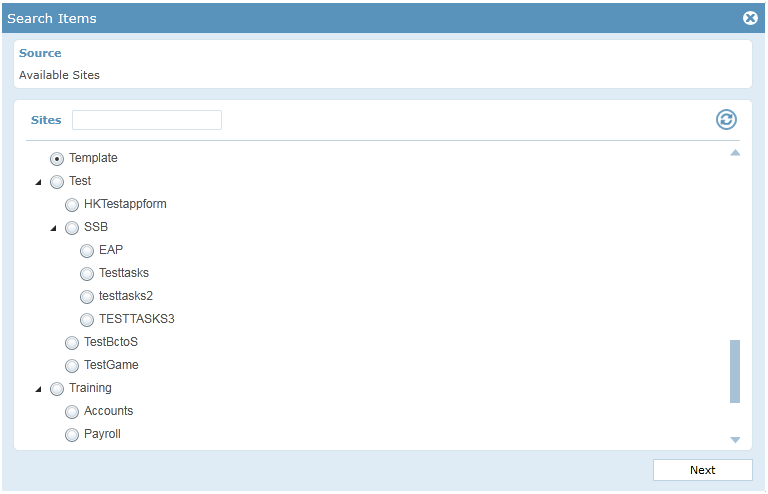
Select the site from the available sites. Click ‘Next’ to continue.
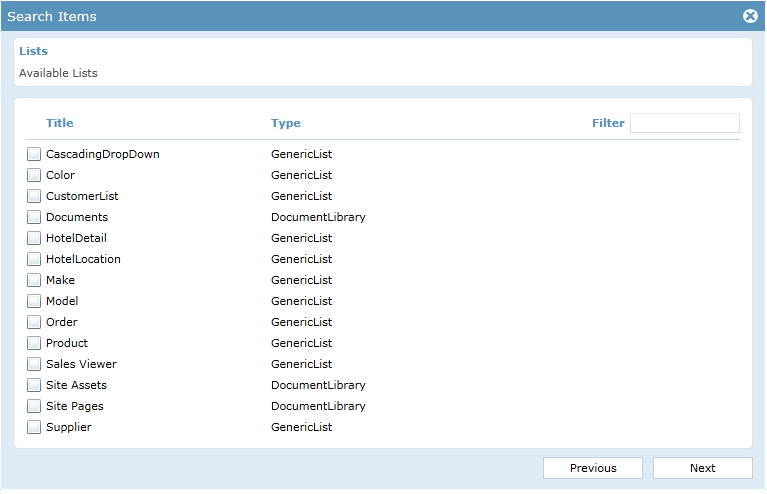
Select the list from available list name. Click ‘Next’ to continue.
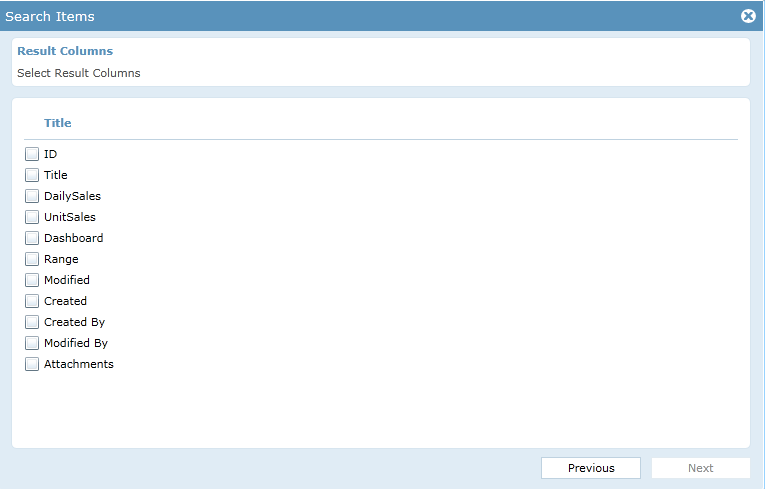
Select the result columns. Click ‘Next’ to continue.
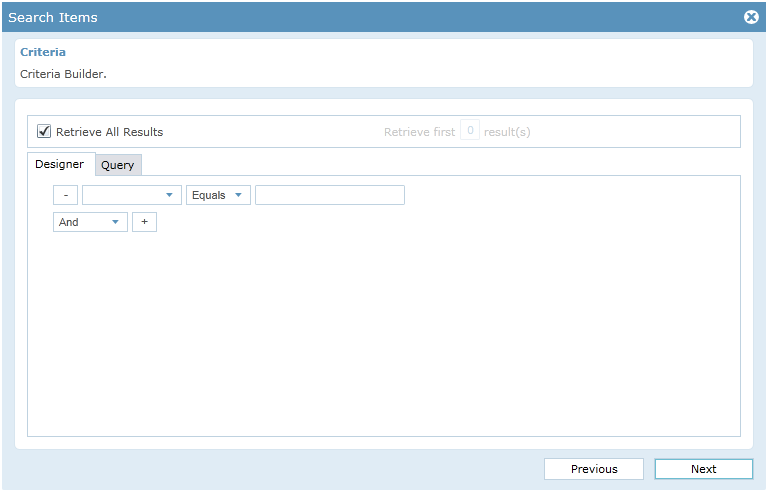
Add the designer criteria in the criteria builder that should select the unique record in the list that matches the user identity criteria in the DataSource and additional and/or Query clauses can be added. Click ‘Next’ to continue.
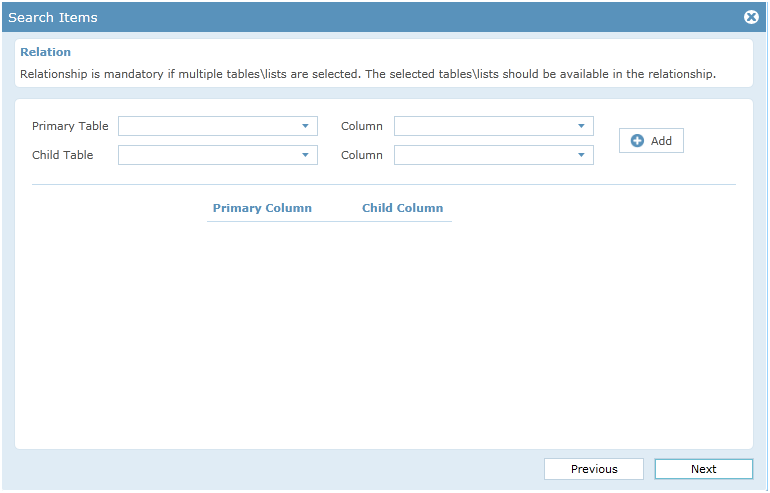
If the selected lists needs any relationship, then we can add their relations here. Click ‘Next’ to continue.
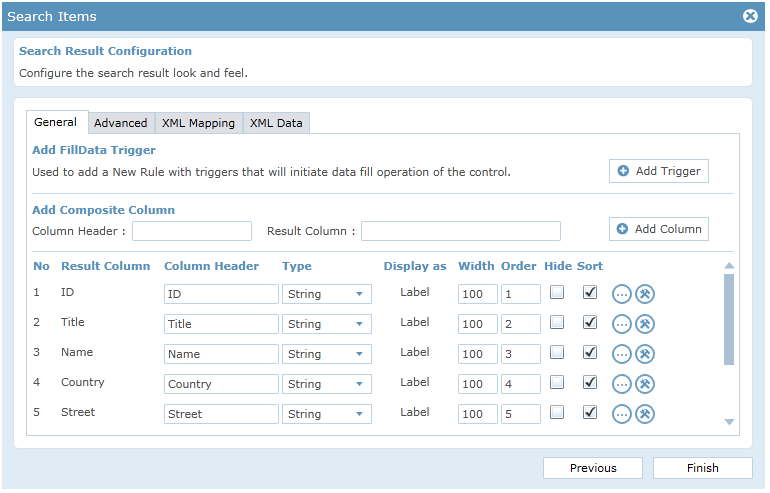
We can change the look and feel of the search control.
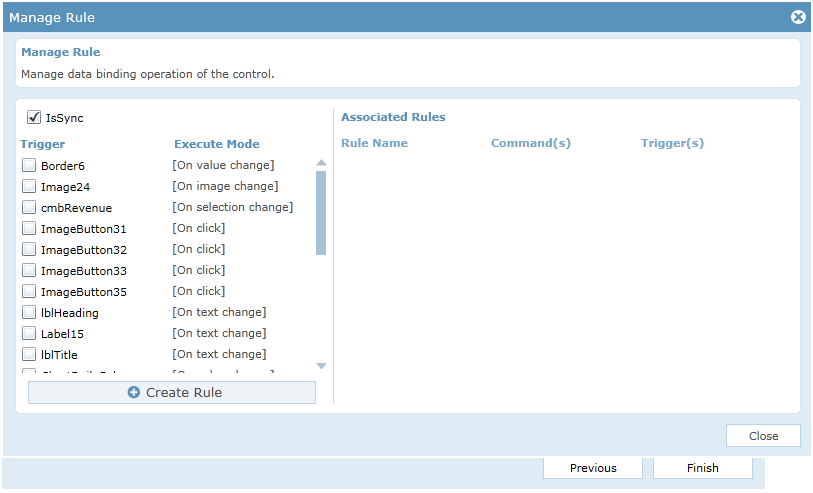
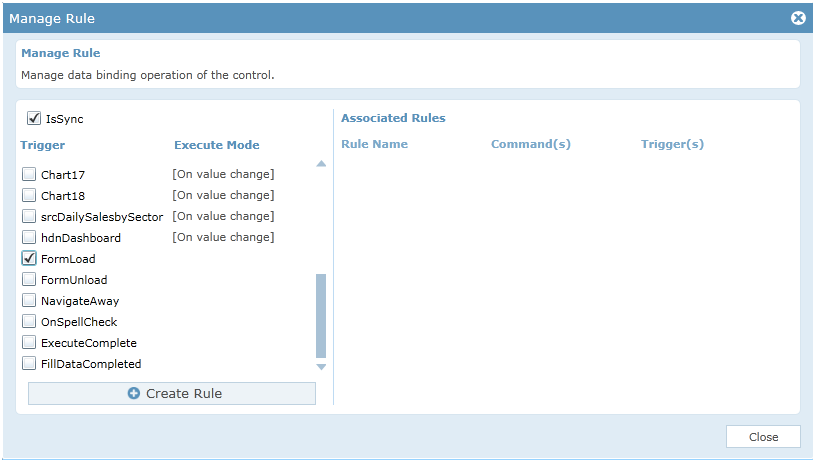
Click ‘Create Rule’ will automatically create the FillData() rule for the search control with associated trigger.
Click ‘Finish’ button to save and close the DataSource configuration process for the search control.
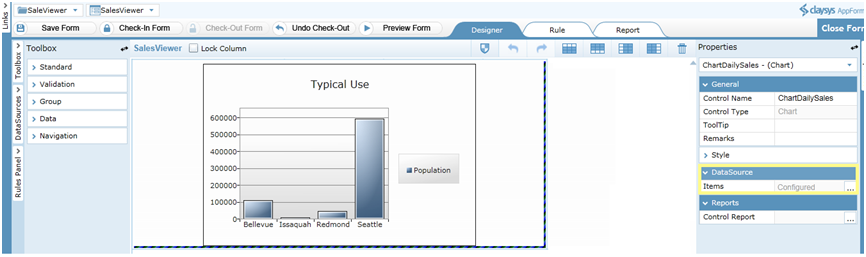
Following steps will explain about the DataSource configuration of Chart control: Before configuring the chart control, a search control should be configured whose data has to be taken for mapping the chart control. Click on the Chart control and select the DataSource.
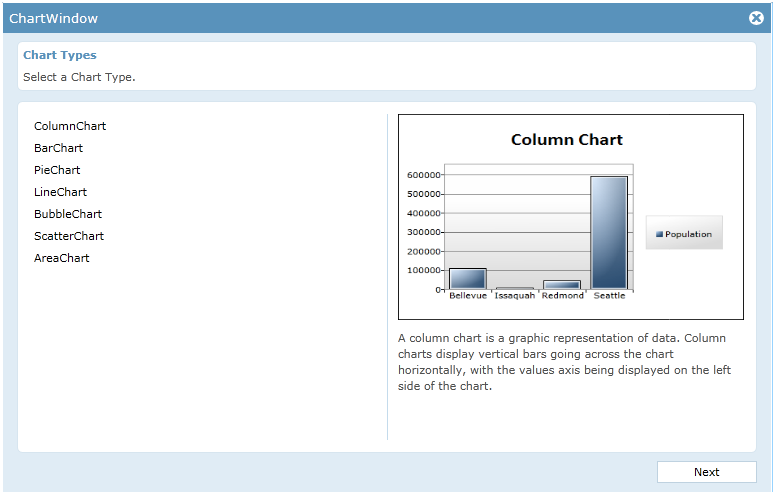
A chart window appears. Select a suitable Chart type. Click ‘Next’ to continue.
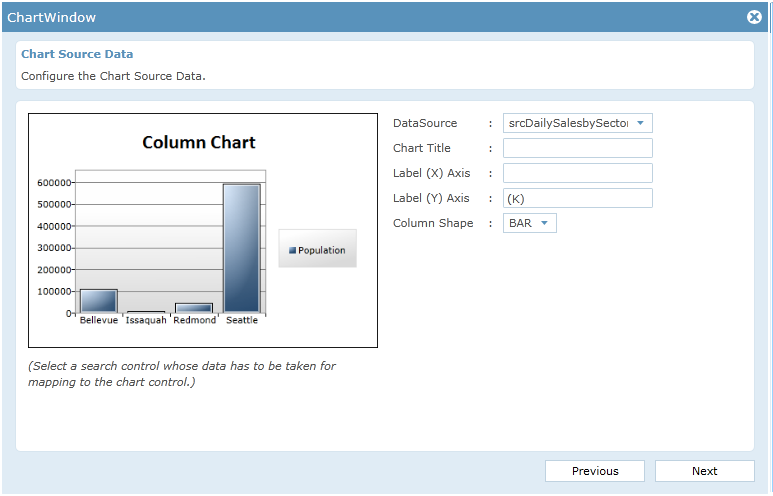
A Chart window appears to configure the Chart source Data. Select the DataSource as a Search control whose data has to be taken for mapping the chart control. Add a Chart title and label the X and Y axis. Click ‘Next’ to continue.
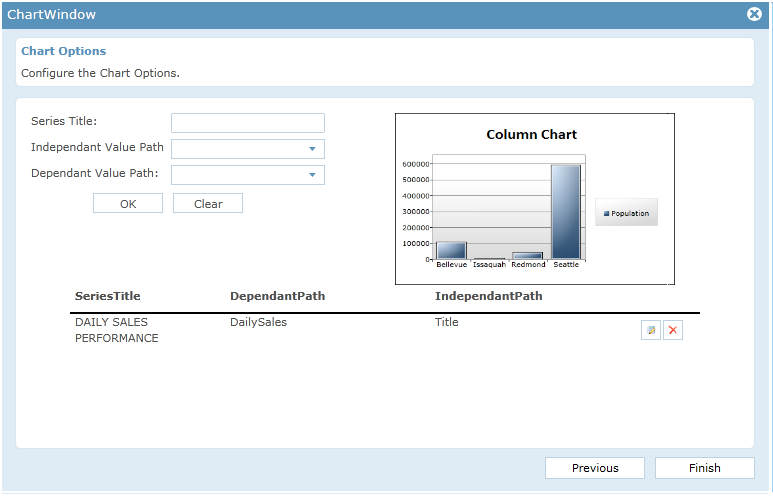
Chart window appears for configuring the Series title, Independent value path and Dependent value path. Click ‘OK’ to add the option. Click ‘Finish’ button to save and close the DataSource configuration process for the Chart control.
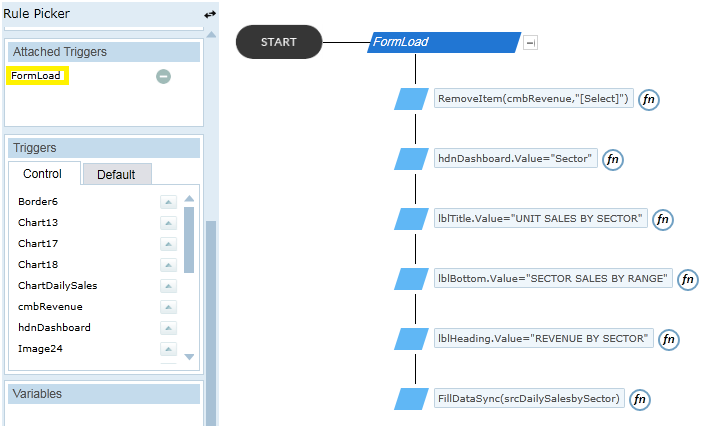
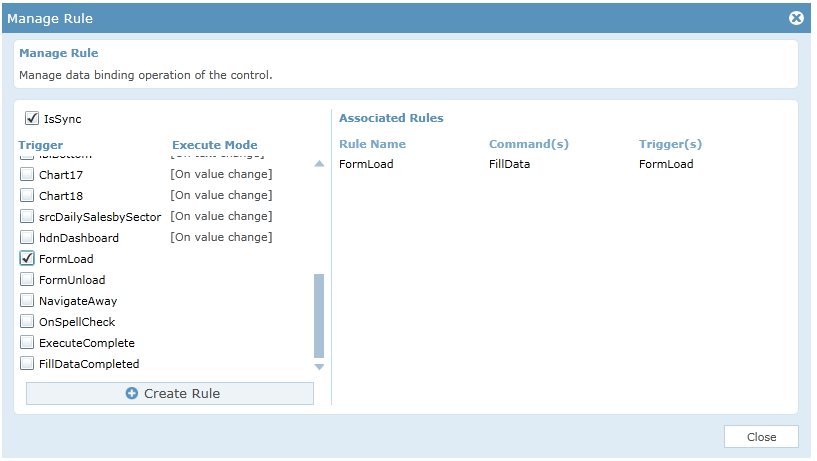
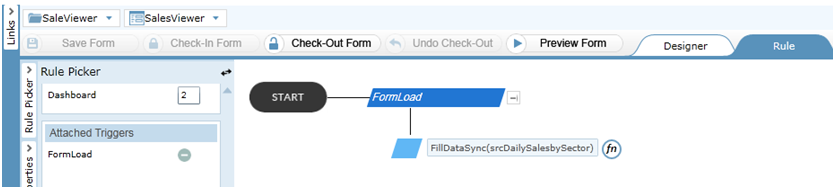
The rules section is the most powerful section in the AppForms. The rules can be configured using the Rules Engine. The rule named ‘FormLoad’, fills the search control and sets the values to label controls on ‘FormLoad’ as trigger.
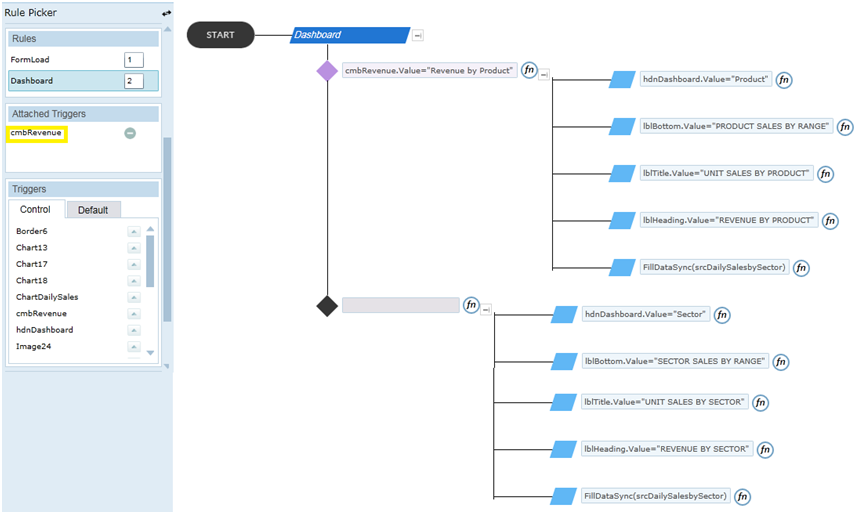
The rule named ‘Dashboard’ fills the search control ‘srcDailySalesbySector’ and sets the values to the label controls based on the value in the combobox ‘cmbRevenue’, on ‘cmbRevenue’ as trigger. Depends on the values in the search control, the Chart controls will be populated. This process is converted into concise, yet readily understood rule expression statements that represent the underlying execution logic of the form as shown in the figure.